API’s GHG Reporting Template Is a Model of Misdirection
The American Petroleum Industry’s greenhouse gas reporting template obscures the U.S. oil & gas industry’s massive responsibility for the climate crisis.
Here at Oil Change International, we’re big fans of data collection and reporting. From tracking the banks fueling climate chaos to improving the International Energy Agency’s scenarios, we’ve championed better information about the fossil fuel industry and the clean energy transition. In theory, then, the American Petroleum Industry’s (API) new greenhouse gas (GHG) reporting template could be a welcome addition. Instead, like our analysis over the past months of other API activities, the template serves as just another tool for obscuring from the public and decision makers the U.S. oil and gas industry’s massive responsibility for the climate crisis. The template gets a few basic things right. But it leaves out major sources of GHG pollution. And it elevates dodgy metrics like carbon capture and emissions intensity.
A little bit right and a whole lot wrong – breaking down the template
API says its new tool supports “more consistent and comparable reporting of key GHG indicators in a template form for voluntary use by individual companies”. To its credit, the template gets a few things right:
Not that API should get many points for including these items. Most of these are standard elements, often required even, in GHG reporting forms in many industries. And they have been for many years. The oil and gas industry-specific elements are valuable, but insufficient. That’s because the rest of the template leaves off crucial information. Simultaneously, it emphasizes factors that misdirect the reader away from the true scale of a company’s pollution.
Hiding Scope 3 Emissions
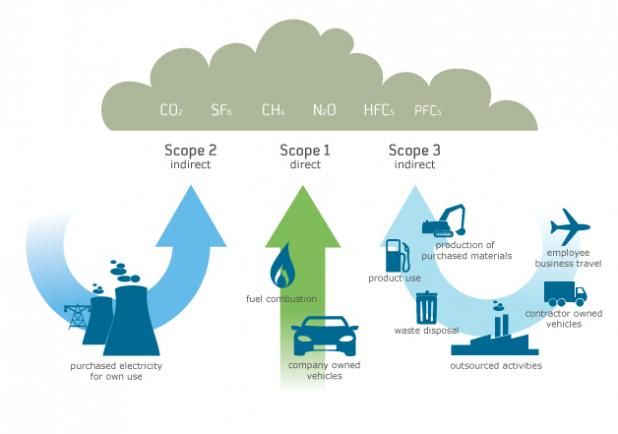
API’s biggest omission is also the simplest to describe. In GHG reporting, Scope 3 emissions (see image below) include the combustion of the fossil fuels that API’s members derive most of their profits from selling. As API well knows, they comprise the largest share, by far, of these companies’ GHG pollution. Yet, the template completely ignores Scope 3 emissions. 92% of U.S. fossil fuel consumption in 2020 went to combustion. Thus, these emissions deeply and directly connect to API members’ operations. They ought to be reported. And API’s omissions don’t stop there.

Source: ecointeligencia.org
Methane’s True Climate Impact
API ignores the most up-to-date science on the size of methane’s heat trapping ability. As we said in our previous post on API’s methane deception, which criticized the Environmental Protection Agency (EPA) for the same problem that API employs in this template (see image below):
“Methane packs a bigger punch to our climate than carbon dioxide…it amounts to ‘over 80 times worse for the climate in the near-term’. You wouldn’t know that from EPA’s analysis, though. EPA uses an outdated factor (25), also known as Global Warming Potential (GWP), to calculate methane’s climate impact compared to carbon dioxide’s. Carbon dioxide has a value of 1, meaning methane is 25 times more damaging, over the same period of time, as carbon dioxide.
However, EPA’s number comes from the Intergovernmental Panel on Climate Change’s (IPCC’s) 4th Assessment Report (AR4) published in 2007. That same factor in the 5th and most recent Assessment Report (AR5), is as high as 36. This higher value reflects an updated scientific understanding of methane’s impact. EPA also uses methane’s 100-year GWP. But methane is a relatively short-lived climate pollutant, with an average lifetime in the atmosphere of less than 2 decades. As the IPCC report itself says, “There is no scientific argument for selecting 100 years compared with other choices”. A 20-year GWP for methane also exists in AR5, with a value as high as 87.”

Source: Oil Change International, based on API Template 1.0 for GHG Reporting
If API and its members really want to report their true GHG impact, they would use the most up-to-date GWP for methane.
The Scope 3 and AR5 omissions alone avoid reporting a massive proportion of GHG pollution that oil and gas companies are responsible for. Further, what API chooses to include in its template worsens this misdirection.
Intensity As a Smokescreen for Impact
We’ve already detailed in a past post how API uses a focus on emissions intensity to claim industry GHG pollution has fallen, when really it rose (see chart below). The template encourages this, giving intensity reporting a prominent position. Intensity can be useful for comparing companies. But it can also easily mislead, as we’ve shown. If API were serious about helping companies report their true climate impact, they’d bury intensity reporting in an appendix. And make it clear that reporting total GHG pollution matters most.
Carbon Capture – Reporting Hype and Hot Air
The template also includes a section for reporting GHG mitigation efforts. This includes carbon capture utilization or storage (CCUS), renewable energy credits, and offsets. Last month, we took a deep dive into the history of CCUS’s false promises (see timeline below), and API’s role in furthering that deception. The template only asks companies to report the total quantity of CCUS. That makes it easy for companies to continue directing all or most of their carbon utilization toward enhanced oil recovery instead of long-term storage. That means companies can get credit for seeming to capture carbon, when really they’re just using it to produce more oil. And that’s to say nothing of the uncertain permanence of CCUS projects. It’s not yet clear whether all CCS projects permanently store their carbon dioxide long into the future. The template only asks companies to report how much carbon they’ve captured, not where it ends up.
Overall, the GHG Reporting Template neatly captures much of API’s bad behavior that we’ve documented over the past several months. From hiding major sources of industry climate pollution, to highlighting intensity and CCUS instead, the template looks like another way for API to claim it supports climate progress, while actually propping up business as usual.

