The Oil & Gas Industry is Gaslighting the IEA on Methane Emissions
For eight years, the International Energy Agency (IEA) has presented research indicating that oil and gas companies can reduce their prolific methane emissions cost-effectively. For eight years, oil and gas companies have failed to do so.
For eight years, the International Energy Agency (IEA) has presented research indicating that oil and gas companies can reduce their prolific methane emissions cost-effectively. For eight years, oil and gas companies have failed to do so, and their emissions have continued to grow, according to the IEA’s own data. Yet, in June, the IEA produced another report that made the same argument, this time specifically assessing the potential for emissions reductions in the liquified natural gas (LNG) supply chain. The report was released at an LNG conference in Tokyo, where Japanese government agencies promoted a misleading narrative about LNG and energy security. Japanese financial institutions are the leading investors in LNG worldwide.
This report also ignores the fact that the world’s largest LNG exporter, the United States, whose oil and gas sector is responsible for more methane emissions than any other, has dismantled the regulatory system that would monitor and enforce its already insufficient methane regulations, while pressuring others to do the same. It is time for the IEA to acknowledge that it is being gaslit.
The IEA first told the oil & gas industry in 2017 that cleaning up methane was cheap
In 2017, the IEA’s flagship annual report, the World Energy Outlook (WEO), presented a special focus on fossil gas. A decade into the fracking boom that led to a surge in gas production, the U.S. began shipping LNG overseas in 2016. The IEA was optimistic that rising global trade in gas, via LNG, was set to transform energy markets.
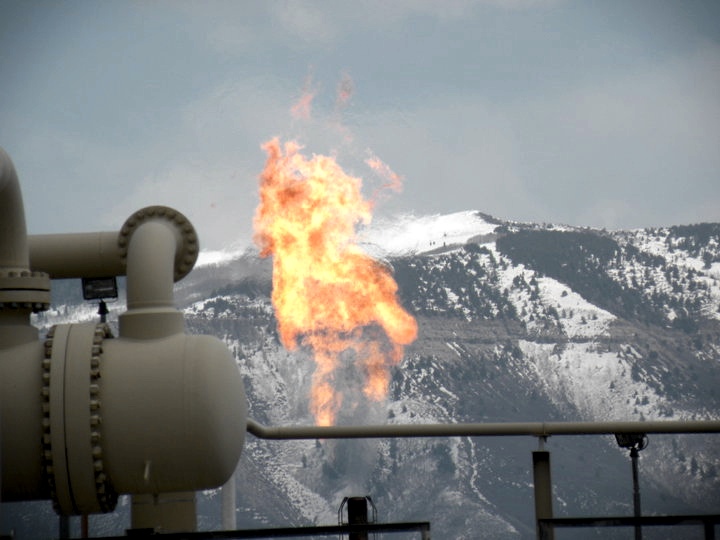
But there was a problem. The U.S. oil and gas industry is plagued by appalling levels of pollution, which harms communities and accelerates climate chaos. The U.S. fracking boom followed the pattern of many a resource boom that had come before. The frenzied clamour of get-rich-quick entrepreneurs was causing chaos in the oil and gas fields of North Dakota, Texas, New Mexico, Oklahoma, Louisiana, Pennsylvania, West Virginia, and elsewhere. Regulators couldn’t keep up. Accidents were common, including crude oil train derailments and explosions.
The entire downtown of Lac-Mégantic in Quebec, Canada, was destroyed when a train carrying U.S. crude oil derailed and exploded, killing 47 people. America’s fracking boom was out of control.
Despite the clear dangers of the U.S. fracking boom, from the IEA’s perspective, the biggest issue was the amount of methane being emitted during the extraction, processing, and transportation of gas. This had become a major controversy, as independent researchers were raising alarms that significantly more methane was being released from U.S. oil and gas fields and related infrastructure than government estimates accounted for. As methane is a greenhouse gas over 80 times more potent than CO2, the case for replacing coal with gas to reduce emissions—already a spurious one at best—was being undermined by the high rate of methane emissions associated with gas production, especially in the United States.
So the IEA set out to do one of the things it does best. It gathered data from oil and gas operations worldwide and developed a model. They referred to it as the Global Marginal Abatement Cost Curve for Oil and Gas Methane Emissions, and it was first publicly presented in the WEO 2017.
The chart below shows the first published cost curve. The horizontal axis represents the volume of potential methane emissions that could be prevented or mitigated, while the vertical axis indicates the associated mitigation costs. The potential emissions savings are color-coded to indicate the source of the emissions, whether from oil or gas operations, and whether the emissions are from the upstream or downstream segments, roughly corresponding to the extraction and distribution stages of the supply chain. The chart clearly shows that the vast majority of preventable emissions come from upstream operations.
Figure 1: IEA’s 2017 Global Marginal Abatement Cost Curve for Oil & Gas Methane Emissions by Source (2015)
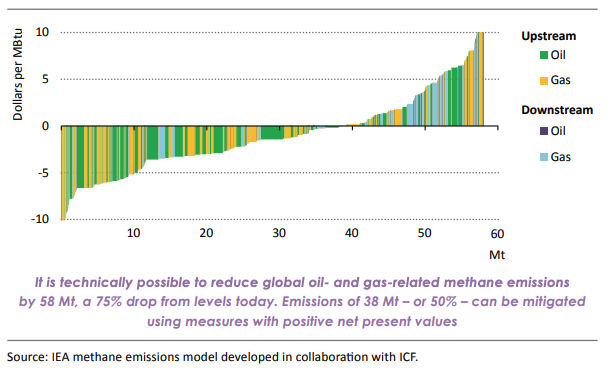
Source: IEA, World Energy Outlook 2017, page 443 (pdf)
The conclusions of the analysis were encouraging. As noted in the figure above, the IEA’s study found that it is technically feasible to mitigate 75% of methane emissions from the oil and gas industry. It also found that the majority of these technically preventable emissions, or about half of the total emitted, could be mitigated at no net cost to the operators. The reasoning was that operators could recover the cost of preventing leakage and reducing routine venting by selling the gas that would have otherwise escaped into the atmosphere. At the far left of the cost curve, controlling these emissions would net the operators up to $10 per million BTU. This is close to the wholesale price of LNG in importing markets in Europe and Asia. The implication was that, at least on paper, controlling methane emissions could be profitable.
The oil & gas industry pledges action
Shortly after the WEO 2017 release, clean energy think-tank the Rocky Mountain Institute announced that eight international oil companies had signed a new “guiding principles” document that signaled their intention to: “continually reduce methane emissions; advance strong performance across gas value chains; improve accuracy of methane emissions data; advocate sound policies and regulations on methane emissions; and increase transparency.”
The IEA’s work on methane emissions and the cost of abatement continued. The WEO 2018 dedicated a chapter to “innovation and the environmental performance of oil & gas supply.” The marginal abatement cost curve this time contained details of the mitigation measures that could be taken.
Figure 2: IEA’s 2018 Marginal Abatement Cost Curve for Oil & Gas Related Methane Emissions by Mitigation Measure (2017)
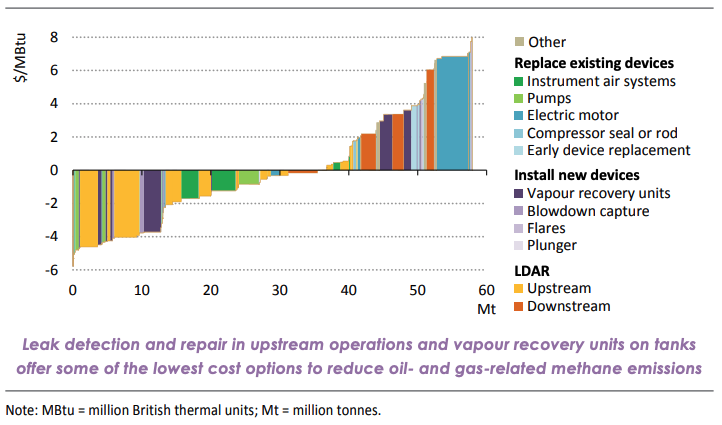
Source: IEA, World Energy Outlook 2018, page 509 (pdf)
The IEA launches the Global Methane Tracker and sets ambitious goals for emissions reduction
In July 2019, the IEA launched the Global Methane Tracker, described as “an interactive tool that provides country-by-country estimates of oil and gas methane emissions and abatement potentials.” The Tracker also estimates methane emissions from other sources, such as agriculture and landfills; however, the primary focus has always been, and remains, on the oil and gas sector due to the abatement curve finding that the majority of the sector’s emissions are preventable at negligible cost to operators.
The drumbeat of IEA messaging on the potential for the oil and gas sector to reduce its methane emissions culminated in a report in October 2021, entitled “Curtailing Methane Emissions from Fossil Fuel Operations: Pathways to a 75% Cut by 2030.”
A few weeks later, the IEA’s Executive Director Fatih Birol joined President Biden and European Commission President von der Leyen at COP 26 in Glasgow, Scotland, to announce the Global Methane Pledge. The IEA’s analysis was central to the goals and targets of the Pledge. The IEA’s statement proudly highlighted how its data, analysis, and advocacy had contributed to the development of the Pledge. A 30% reduction of all global sources of anthropogenic methane emissions by 2030 would be led by the sector with the easiest and lowest-cost abatement opportunities, according to the IEA’s analysis: the global oil and gas industry.
Pledges fail to translate into action
Since then, the Global Methane Tracker has been published annually, with the latest update in May 2025. With six years to go until 2030 (the 2025 report tracks 2024 data), when the oil and gas sector is supposed to have reduced its methane emissions by 75%, the outlook is dismal.
While emissions dropped in 2020 due to the shutdown of oil and gas wells at the height of the COVID-19 pandemic, emissions have increased every year since (See Figure 3). Despite commitments from 159 countries as part of the Global Methane Pledge, numerous claims of progress by various oil and gas industry groups, and the rise of greenwashing gas certification companies that have declared as much as 40% of U.S. gas as “low-emissions,” the data show that the industry is, in fact, going backward. Since the Global Methane Pledge was announced in 2021, global oil and gas sector methane emissions have increased by 4.5%.
Figure 3: IEA’s Estimated Global Oil & Gas Sector Methane Emissions (2024)
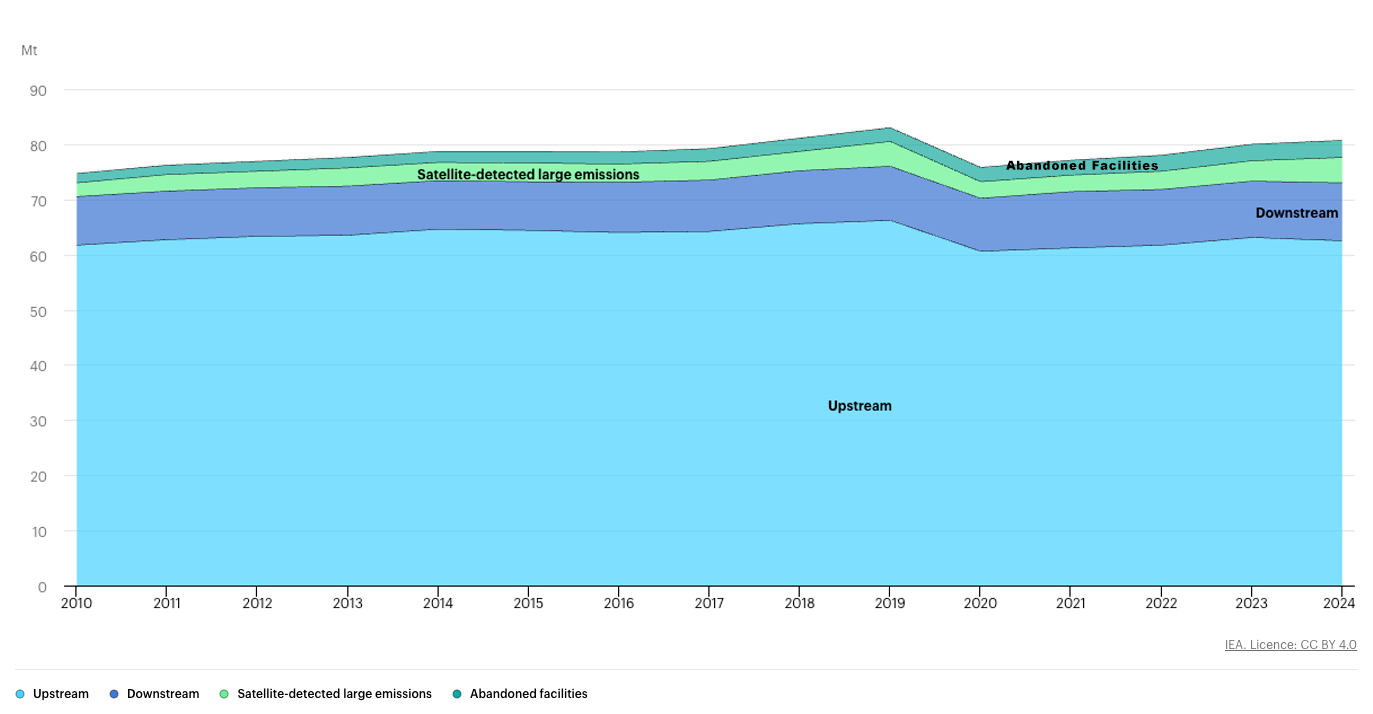
Source: IEA Global Methane Tracker 2025
Emissions intensity is not going down
The industry’s failure is as disturbing as its penchant for greenwash. Companies and industry lobbyists often claim that emissions intensity, which is the amount of emissions per unit of production, is decreasing even as total emissions increase. They reason that oil and gas demand is rising, so production is increasing to meet that demand, resulting in overall emissions rising even as the industry supposedly reduces the intensity of its gas emissions. However, this line of reasoning doesn’t stand up to scrutiny. The data indicate that since 2021, emissions have risen slightly more than production, indicating an increase, or at the very least, no reduction in emissions intensity. It is clear from this that pledges and industry self-regulation are failing to clean up the gas supply chain.
Figure 4: Global Oil & Gas Sector Methane Emissions Rise with Oil & Gas Production
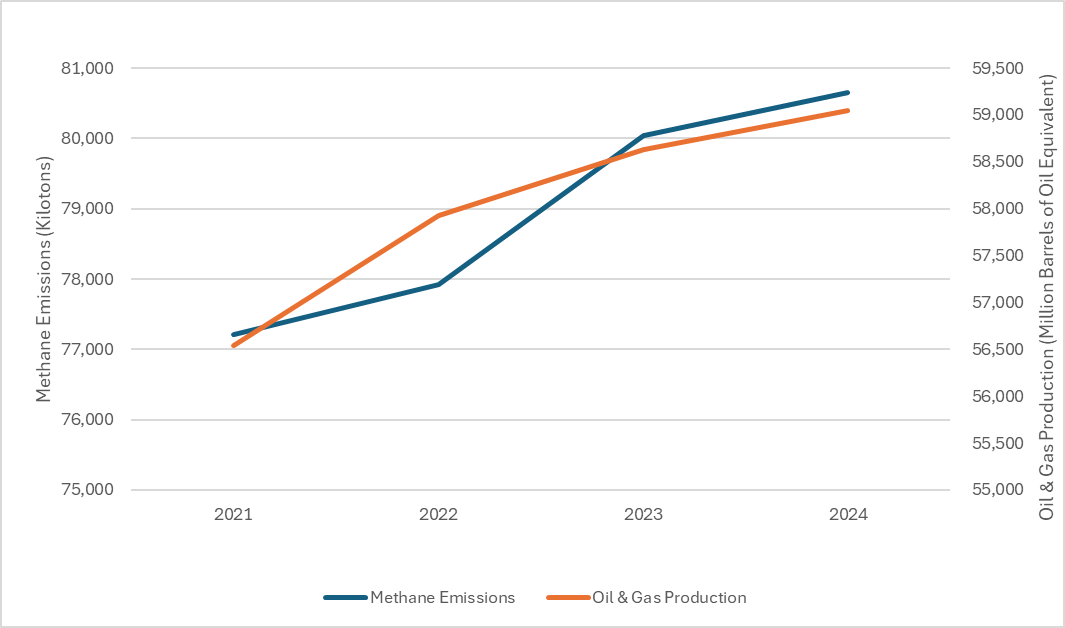
Source: IEA Global Methane Tracker 2025 and Rystad Energy Ucube (August 2025)
The IEA continues to push the abatement cost-curve narrative
Despite the IEA’s own data revealing the failure of industry initiatives to reduce methane emissions, the IEA continues to promote the narrative that the oil and gas industry is on the cusp of significant change. In June, it published a report detailing the lifecycle emissions of the global LNG supply chain and the potential for emissions abatement. It was the latest iteration of a story that has been told since 2017.
However, this report went even further, claiming that LNG process emissions could be reduced not only via methane abatement but also, for example, by powering LNG plants with renewables and capturing CO2 for storage (CCS). CCS is a proven failure and clearly not a solution to anything other than the fossil fuel industry’s much-needed demise.
The IEA’s LNG emissions report misses the real solution to gas emissions despite its own research showing the way
Reducing methane emissions in the LNG supply chain, as well as that of oil and gas, more generally, can help address climate change. It is also vital because those emissions are often associated with the release of volatile organic compounds (VOCs) and other pollutants that impact the health and safety of communities living near oil and gas infrastructure. However, addressing this prolific waste and pollution is nowhere near enough to address the climate crisis.
A recent analysis of US LNG export expansion clearly shows that increasing LNG exports leads to higher net emissions, even when methane emissions in the supply chain are minimized. This is because the proliferation of LNG exports competes with cleaner sources of energy in the global market, displacing renewable energy and locking in the combustion of gas in place of wind, solar, and other clean energy sources.
The IEA is aware of this and has published analyses supporting this case on multiple occasions. In 2021, the IEA published for the first time a scenario that mapped out a pathway to achieving the Paris Agreement goal of limiting climate change to 1.5°C. It was called the Net Zero Emissions Scenario (NZE). In the report, the IEA made clear that there was no more room for additional LNG export capacity.
“No new natural gas fields are needed in the NZE beyond those already under development. Also not needed are many of the liquefied natural gas (LNG) liquefaction facilities currently under construction or at the planning stage. Between 2020 and 2050, natural gas traded as LNG falls by 60% and trade by pipeline falls by 65%.”
In the WEO 2024, the IEA included a graphic that made this even clearer. Not only are the LNG terminals that are under construction not aligned with a 1.5℃ pathway, but most of that capacity also does not align with a pathway in which climate and energy policies already approved by the world’s governments (labeled APS [Approved Policies Scenario] in the graphic), but insufficient to achieve 1.5°C, are implemented.
Figure 5: LNG Trade by IEA Scenario Relative to Existing and Under-Construction Export Capacity to 2050
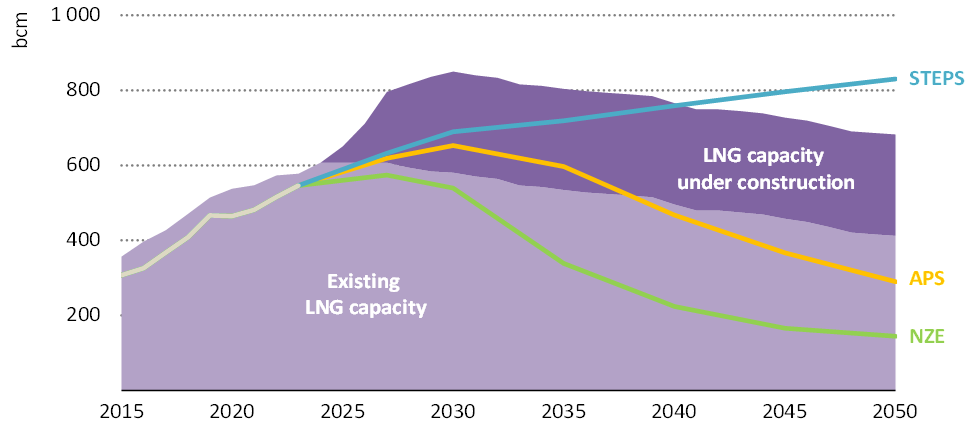
Source: IEA World Energy Outlook 2024, p. 180
The relationship between LNG trade and the Net Zero Emissions (NZE) scenario in this chart is based on the expectation that the industry will meet the 75% methane reduction target by 2030, as discussed above. Therefore, if the industry fails to achieve the methane reductions, which the current course clearly indicates, there will be even less room for LNG trade if the goals of the NZE are to be met. The message is unequivocal. Even if the industry cleans up its act, limiting methane leakage and venting, there must be a substantial reduction in LNG trade. But the industry is going in the opposite direction. It is neither cleaning up nor reducing trade. It is, in fact, doubling down on the climate crisis.
The recent IEA report on LNG emissions and the potential for clean-up was a curious intervention by an institution that, over the past four years, has consistently made the case that a safe climate means using less fossil fuels. It undermined the most crucial message of its work on Net Zero and climate policy. That is, a safe climate requires phasing out fossil fuels. Cleaning up the oil and gas industry’s prolific methane emissions, which can only be achieved with robustly enforced protections against methane pollution and the preservation of existing policies, such as the European Methane Regulation, rather than the current smokescreen of voluntary initiatives, is part of that imperative. It is not an alternative to it.