Report

Pay Baby Pay: Why Trump’s Energy and AI Dominance Agenda Means Higher Bills For Everyone

By Lorne Stockman

U.S. wholesale fossil gas prices will likely double by the mid-2030s relative to the 2020-2025 average, if the Trump administration’s energy and AI policies succeed in pushing gas demand to levels that can only be met by more expensive gas production.

Executive Summary

Key Findings

  • U.S. wholesale fossil gas prices will likely double by the late 2030s relative to the 2020 to 2025 average if the Trump administration’s energy and AI policies succeed in pushing gas demand to levels that can only be met by more expensive gas production.
  • Significant energy price volatility from 2020 to 2025 caused hardship in the U.S. and in LNG-importing countries, particularly in Asia and Europe. Costlier U.S. gas risks exacerbating the energy affordability crisis for U.S. and international consumers alike.
  • The surge in gas demand – and gas prices – is being driven primarily by the Trump administration’s support for massive increases in liquefied natural gas (LNG) exports. Trump’s hostility toward renewables and support for the poorly regulated AI data center boom aggravate the impending crunch.
  • Lower-cost gas from the two biggest U.S. gas-producing regions, the Permian and Appalachian basins, will not be able to meet rising demand alone. To fill the gap between demand and production, gas producers will have to increase drilling in the significantly more expensive Haynesville shale play in Louisiana and Texas.
  • The surge in U.S. LNG export capacity will increase the share of global LNG contracts linked to the U.S. wholesale gas price (Henry Hub) to beyond 50 percent by the mid-2030s. This would likely result in higher U.S. prices being transferred across the global LNG market.
  • The crisis in the Persian Gulf caused by the Israeli and U.S. attacks on Iran has only made it more urgent to transition away from fossil fuels as quickly as possible to reduce exposure to rising international gas prices. While Henry Hub gas prices have been relatively stable since the conflict began, this does not indicate future trends. As massive new LNG export capacity comes online, analysts project rising production costs that will drive wholesale prices higher.

Trump Policies are Maximizing Demand For U.S. Fossil GasFossil gas, which we will usually refer to as simply “gas” in this report, is not the same as the gasoline that powers vehicles. “Fossil gas” is the gas that is used in stoves, for heating homes, and for generating electricity.

The United States has been experiencing an oil and gas boom for over two decades and has become the world’s largest producer, consumer, and exporter of fossil gas. This has come at great cost to the climate, the environment, and the health of communities across the country.

During the first 15 years of the boom, rising production lowered fossil gas prices for U.S. consumers. Since 2020, that has changed. Consumer gas prices have been volatile and rising over the past five years and are likely to continue this trend, worsening the energy affordability crisis for households and businesses in the U.S. and internationally.

The Trump administration’s energy and AI “dominance” policies are exacerbating the situation. After Trump lifted the Biden-era pause on new LNG export licenses and signaled his enthusiastic support for increased LNG exports, almost 90 million tons of new U.S. LNG capacity reached a final investment decision (FID) as of June 2026. Together with the 60 million tons of capacity already under construction, U.S. LNG exports, already the world’s largest, could double by the early 2030s and continue to grow.

The Trump administration’s hostility to renewable energy, attacking offshore wind development and ending tax credits for solar and wind power in the One Big Beautiful Bill Act, may increase the already large role of gas in U.S. electricity production, just as the demand for electricity is rising.

Rising electricity demand is itself being aggravated by the administration’s push for AI dominance. A massive expansion of U.S. data centers is underway, estimated to raise gas demand for power generation by up to 17 percent by the early 2030s.

This report draws on projections and analyses from two energy industry analytics firms that concur that U.S. gas supply can only keep pace if prices rise. U.S. consumers and consumers in LNG-importing countries in Europe, Asia, and elsewhere risk bearing the cost.

Meeting Surging Gas Demand Will Require Costlier Gas

If current industry plans for LNG exports and gas power plants are realized, the surge in demand for U.S. gas will push gas producers to invest in costlier gas production than in the past. The two largest and lowest-cost gas-producing basins, the Permian in Texas and New Mexico, and the Appalachian in Pennsylvania, West Virginia, and Ohio, will not be able to meet the increase in demand alone. The Haynesville shale basin in Louisiana and East Texas is expected to account for nearly two-thirds of net production growth by 2035, but drilling costs there are much higher due to deeper and more complex geology. This makes the Haynesville the “marginal source of supply,” meaning that as demand grows, prices will need to rise to incentivize production from this more costly source.

Projections show an impending pronounced upward shift in the cost of U.S. gas production

The U.S. gas that is cheapest to produce is being rapidly depleted. This is shown through an analysis of the projected “breakeven price” of producing U.S. gas through 2040. The breakeven price is the minimum price at which a company can cover its costs and turn a profit on each unit produced. Starting in 2026, the amount of gas that can be produced at less than a USD 2 per thousand cubic feet (mcf) breakeven price falls off a cliff. This is primarily because of the steep decline rates of fracked wells. Most, if not all, of the gas in that bracket is being produced today; the wells are already drilled, so costs are sunk, and the breakeven price of continued production is low. It is the breakeven price for drilling new wells, not only to replace the decline of today’s producing wells but also to meet surging demand, which is significant in shaping future prices.

The price bands in Figure ES1 indicate that, for U.S. gas production to keep growing beyond 2030, prices must rise above $4/mcf. Production requiring prices above $4/mcf is expected to account for close to 20 percent of production by the late 2030s. While this represents only one-fifth of overall production, it is the most significant factor for future gas prices. This is because, as demand grows, it is not the average cost of production that exerts the most influence on prices, but rather the cost of meeting the next increment of demand growth.

From the early 2030s onward, it is not only gas in the $3-4/mcf price band that expands, but the last increments of demand growth are expected to be met by gas that requires prices of $4/mcf or higher to be brought online. This implies that wholesale prices will need to remain at this level to incentivize enough gas production to meet rising demand. The implication is that the breakeven price of the marginal source of supply, the supply source that is brought online to meet the last increment of demand growth, is significantly higher than the average wholesale price over the last 10 years ($3.30/mcf or $3.18/MMBtu).

Figure ES 1

Projected U.S. Gas Production by Breakeven Price

These cost increases are reflected in forecasts of wholesale gas prices (Figure ES2). The Henry Hub gas price benchmark, the key pricing mechanism for U.S. gas both domestically and internationally, is expected to exceed the Federal Reserve’s 2 percent inflation target for most of the period from now through 2040.

Between 2026 and 2040, the average wholesale price of gas could be 80 percent higher than during the past decade of U.S. LNG exports, a decade when energy price volatility was already causing hardship in the U.S. and LNG-importing countries. Prices could double relative to the 2020 to 2025 average by the late 2030s. This price forecast assumes that demand for U.S. gas, led primarily by burgeoning LNG exports, continues to rise, driving U.S. gas producers into more costly production.

Figure ES 2

Gas and electricity consumers in the U.S. and internationally will likely feel the pain

The wholesale price of U.S. gas directly affects the prices U.S. consumers pay to heat and power their homes. We saw evidence of this in the 2010s, the first full decade of the fracking boom, when lower wholesale prices were associated with lower prices for power producers and industrial, commercial, and residential gas consumers. When wholesale prices rose in 2021, 2022, and 2025, so did the price everyone paid.

Higher wholesale prices are highly likely to lead to higher prices for all gas consumers, as the cost of gas is the biggest single factor in the price consumers pay. If the past is an indicator, the impacts are likely to be unevenly distributed both regionally and between sectors, with residential users typically paying the highest prices.

The impact of rising gas prices on U.S. electricity prices is more complex, but it is clearly a factor in recent electricity price hikes, together with rising infrastructure costs and extreme weather events. The continued dominance of gas-fired power on U.S. grids, reinforced by the Trump administration’s hostility to renewable energy, leaves electricity consumers vulnerable to rising wholesale gas prices.

Despite an expected glut, rising U.S. LNG exports could raise the price of LNG for importers

The surge in U.S. LNG export construction has led to expectations of a near-term oversupply in the global LNG market. Many market analysts and gas companies have expected this looming “glut” to lower LNG prices in importing regions.

The March 2026 bombing of the world’s largest LNG plant in Qatar has likely delayed the expected glut and reduced the overall extent of any oversupply, as repairs are slated to take years and planned expansions are also delayed. The closure of the Strait of Hormuz also sent benchmark European and Asian gas prices soaring, underscoring the volatility and vulnerability of LNG markets.

U.S. gas and LNG executives have dismissed concerns about the impact of glut-driven low prices on their profitability, arguing that low prices will stimulate new demand, particularly in Asia, and therefore will not persist. The lesson for countries reliant on imported LNG is clear: Low prices will be temporary if demand catches up with supply. If the response to glut-driven low LNG prices is to greenlight new gas power plants or other long-term structural gas-demand infrastructure, the supply-and-demand balance will tighten, and prices will rise.

The findings of this report suggest that if importers increase LNG demand in line with expanding U.S. export capacity, they risk locking in high LNG prices due to rising U.S. gas production costs. This may impact the LNG market more broadly, given the increasing proportion of contracted LNG indexed to Henry Hub prices in the global market.

Most U.S. LNG is sold under long-term contracts, and these export contracts include a pricing mechanism based on the prevailing Henry Hub price at the time the gas is purchased. This is called indexing. When Henry Hub goes up, so does the price of U.S. LNG. The impact is amplified by a 15 percent premium that exporters charge to cover the gas used in the liquefaction process. So, for example, if the Henry Hub price is $3/MMBtu, the LNG purchaser will pay $3.45/MMBtu. If it rises to $5/MMBtu, the LNG purchaser will pay $5.75/MMBtu. This is before factoring in liquefaction fees, which are also rising.

As the share of U.S. LNG in the market increases, so will the percentage of global LNG contracts indexed to Henry Hub. While the proportion of U.S. LNG in the global market is expected to rise to just under 35 percent by the mid-2030s, the proportion of contracted LNG linked to Henry Hub prices is set to surpass 50 percent by 2033 (Figure ES3). Therefore, the majority of contracted LNG in the market will be linked to Henry Hub prices. If Henry Hub prices rise, so will the cost of the LNG tied to those contracts. This has the potential to exert an increasing influence on LNG pricing in importing regions, with serious implications for energy affordability in Europe, Asia, and beyond.

Figure ES 3

Conclusion & Recommendations

If industry succeeds in locking in unprecedented demand for U.S. gas by expanding exports and domestic consumption, U.S. supply may be pushed to its limits. Gas supply can only meet such high levels of demand if prices rise to cover the higher production costs of marginal gas supplies. This connects rising dependence on gas to rising energy costs. U.S. consumers and those in LNG-importing countries must push policymakers to reduce dependence on fossil fuels and accelerate the transition to reliable, affordable renewable energy.

  • Congress must stand up against the Trump administration’s hostility to affordable renewable energy, which raises costs for households in the U.S. and abroad by increasing reliance on limited fossil gas supplies.
  • U.S. political leaders must:
    • Cut fossil fuel subsidies and reinstate programs that support a just transition to renewable energy.
    • Support Data Center Moratoriums at the state and local levels to limit soaring gas demand and energy price increases for U.S. consumers.
    • Mandate agencies to stop the expansion of fossil fuel production. The U.S. Federal Energy Regulatory Commission (FERC) and the Department of Energy (DOE) should deny applications to build or expand LNG export facilities.
  • The governments of LNG-importing countries should accelerate the transition to renewable energy, setting specific goals to reduce gas demand as part of planned, government-led, binding roadmaps for implementing a fair, fast, full, and funded phase-out of fossil fuels.
  • Effective international cooperation is critical to making a fair phase-out possible for lower-income countries in the Global South that depend on gas imports or production. Other wealthy governments of the Global North, especially the EU and Japan, must counter the Trump administration’s backsliding and cooperate towards stable, affordable, and sovereign economies by:
    • immediately ending their public finance for fossil fuel projects, as laid out in multiple international agreements;
    • delivering their fair share of debt-free international public finance for a just energy transition;
    • backing changes to unfair economic rules that impede the ability of Global South countries to move beyond volatile gas dependence; and
    • resisting pressure from the Trump administration to spend billions on U.S. LNG and water down important legislation.

Introduction

The United States is entering the third decade of an oil and gas boom precipitated by the development of hydraulic fracturing (fracking) and horizontal drilling. In that time, the U.S. has moved from being a major importer of oil and gas to the world’s largest producer and exporter of both commoditiesThe United States became the world’s biggest gas (LNG) exporter in 2023. While Saudi Arabia exports more crude oil than the U.S., the latter’s total exports of petroleum, crude and refined and unfinished products, exceeds that of any other country, making the U.S. the world’s largest exporter of petroleum. See Arathy Somasekhar, “Once an Arab Oil Embargo Victim, US Becomes World’s Top Oil Exporter,” Reuters, June 11, 2026.. In 2025, the U.S. produced over 27 percent of the world’s fossil gas.1

In the 2010s, as surging gas production outpaced domestic demand, gas exports soared. These began with exports to Mexico via pipelines. In February 2016, the first liquefied natural gas (LNG) cargo left Cheniere’s new Sabine Pass terminal in Louisiana, marking the beginning of an era central to the concerns raised in this report.2 If the gas industry’s plans to increase both U.S. LNG exports and domestic gas consumption to record levels are realized, the price consumers pay for gas will have to rise for production to keep up.

Figure 1

Since 2021, domestic consumers have felt the consequences of the U.S. exporting an increasing proportion of its gas. Coupled with a shift from stagnant electricity demand to robust growth and an increasing reliance on gas for power generation, the price of fossil gas is exerting pressure on the cost of living for millions of U.S. households. U.S. government data shows that household gas costs have increased nearly 40 percent since 2019, and nearly 80 million people struggle to afford their electricity bills.4 The findings of this report indicate that this will likely get worse unless gas dependence is curbed.

The Trump administration’s energy policy focuses on increasing fossil fuel production and exports while undermining renewable energy. One of the administration’s first acts was to lift the Biden administration’s pause on new LNG export authorizations.5 With the Trump administration’s encouragement, a record 67 million metric tons (mtpa) of new U.S. LNG capacity reached a final investment decision (FID) in 2025, while an additional 23 mtpa was greenlit in 2026.6 If all the U.S. projects currently under construction and currently commissioningLNG plants take many months to ramp up to full capacity. During this commissioning period it is not uncommon for LNG production to be paused while issues are addressed. Therefore, the start date for first LNG production is not a good indicator of when full capacity will be available. are utilized at similar levels to existing projects, U.S. LNG exports, already the world’s largest, could double from 2025 levels by the early 2030s.

The administration has also made artificial intelligence (AI) a strategic priority. Two analyst projections suggest that energy-hungry data centers could raise gas demand for power generation by around 17 percent by the mid 2030s.7 Meanwhile, Congress passed a bill in July 2025, slashing tax credits for renewable energy and increasing them for fossil fuels.8 The Trump administration has attacked offshore wind projects with illegal work-stoppage orders and has gone so far as to return nearly USD 1 billion to the French oil giant TotalEnergies after canceling its offshore wind leases, a move that may also be illegal.9

The administration’s emphasis on so-called “energy dominance” via oil and gas development and exports comes at a time when the U.S. oil and gas boom is maturing. For at least the past five years, U.S. producers have shifted their strategies from production growth at any cost to a focus on investor returns. Now, as LNG export growth and rising demand for gas to power data centers converge to require a projected 35 percent rise in gas production over the next dozen years35% U.S. gas production increase based on 2025 to projected peak year (2038) in Rystad Energy Ucube (June 2026), decisions to invest in production growth are clearly determined by profitability.

This report details how the growth in production required to meet expected demand from the surge in both exports and data center demand can only be achieved through higher prices. We present data and analysis from leading oil and gas industry sources that suggest that the price of U.S. gas must rise to incentivize the expected production growth. The implication is higher prices for U.S. households and businesses, as well as for those in countries importing U.S. LNG.

Data Sources and Projections in This Report

The primary source of data in this report is the Rystad Energy UCube database, a subscription service that tracks the upstream oil and gas industry.10 Throughout the report, we cite figures from the UCube on the historical trajectory of U.S. gas production and projections for the future. All figures not otherwise cited are from the June 2026 update of the UCube database.

The projections of gas production, wholesale prices, and breakeven prices discussed in this report should naturally be viewed differently from historical data, which is based on government and company records. Projections are informed by modeling of current market conditions and price forecasts, existing government policies, company statements, past company performance, technological developments, and geological attributes, among other factors. While these projections are informed by a rich array of data, they are not set in stone. Unforeseeable external events, such as Russia’s invasion of Ukraine or the U.S.-Israeli war on Iran, can cause major changes to energy projections. A change in government or in the policies of existing governments can significantly alter the trajectory of energy production or demand.

The findings of this report lean heavily on these projections, providing a warning of the affordability impacts likely to occur unless policymakers take action. While Rystad Energy is the primary source for production and breakeven price data and projections, we draw on analyses from BloombergNEF, the U.S. Department of Energy’s Energy Information Administration (EIA), and Wood Mackenzie that corroborate the trend toward surging gas demand and rising prices under baseline policy conditions. While market developments could alter these outcomes to some degree, the most effective way to prevent the impacts warned about in this report is to develop explicit government policies to accelerate a just transition away from all fossil fuels and build a resilient energy future based on renewable energy and supported with energy storage, energy efficiency, and other electricity grid developments and innovations.

The First Full Decade (2010 to 2019) of the Fracking Boom Lowered Prices From Previous Highs

The 2010s saw gas production surge ahead of U.S. consumption, even as consumption grew by nearly 30 percent (Figure 2). This helped lower U.S. wholesale gas prices, which in turn led to lower prices for U.S. gas consumers (Figure 3). Gas exports via pipeline to Mexico grew quickly, and in 2016, LNG exports from the Gulf Coast took off (Figure 5). By 2019, total exports had surged 800 percent from 2010 levels, and gas had become the leading source of U.S. electricity generation (Figure 4).

While fracking had been in use to a limited extent since the late 1990s, it began to have a noticeable impact on U.S. gas production in the late 2000s. By 2011, U.S. conventional gas production was in steep decline, while gas produced from “shale plays” using fracking was growing so fast that total U.S. gas production hit an all-time record.

Earlier in the 2000s, U.S. oil and gas production stagnated and declined while demand for oil increased due to the rising popularity of large gas-guzzling vehicles. Global oil demand was also rising rapidly as Asian economies, especially China’s, experienced high growth rates and increased oil consumption. Oil prices hit a high of $147 per barrel in 2008, equivalent to around $225 today, and this is widely seen as having helped trigger the global recession that began in 2008.11 This is important context for the gas price declines discussed below, as these declines occurred after a very turbulent period in which prices hit record highs.

Gas consumption rose, but not as fast as production

With the fracking boom already well underway by 2010, gas production and consumption entered a decade of rampant growth. Between 2010 and 2019, production grew by 60 percent while total domestic gas consumption grew by 29 percent. The strongest demand growth was in the power sector (53 percent), while industrial and commercial demand for gas grew modestly(23 percent and 13 percent, respectively), and residential demand, which is household demand primarily for cooking and heating, increased by only 5 percent.

Figure 2

When production of a commodity rises much faster than consumption, you can expect the price to fall. This was the case with U.S. fossil gas prices during the first full decade of the fracking boom. Between 2000 and 2009, the period before the full take-off of the fracking boom, and 2010 to 2019, when it was in full effect, the average wholesale price for gas (Henry Hub) dropped by 43 percent (Figure 3). The average inflation rate during this period was relatively low at 1.8 percent,13 so these price declines represented significant cost deflation.

The average decline in gas prices differed across subsectors, ranging from a 35 percent drop in the power sector to only a 4 percent drop for residential use. This variation may have something to do with the scale of gas consumption across these sectors, with the power sector’s greater demand enabling it to benefit from greater cost deflation. It may also be related to differences in how subsectors are regulated by public utility commissions. Whatever the exact reason, it seems clear that residential users saw less of the benefit of cheaper gas compared to other users. There may also have been regional differences in these price dynamics that are hidden by the national averages.

Figure 3

Gas became leading source of electricity generation

Gas became the leading source of electricity generation in the U.S., surpassing coal in 2016. This occurred during a period in which overall electricity demand was essentially flat. In 2019, gas generated over 38 percent of U.S. electricity, up from 24 percent in 2010 (Figure 4). Electricity prices rose modestly during this period, by 0.7 percent across all sectors and by 1.2 percent for residential users.15 This was below the average inflation rate of 1.8 percent. This changed dramatically after 2020, as we will see in the next section.

Figure 4

U.S. Electricity Net Generation by Source 2010-2019

Exports surged

In February 2016, the first cargo of LNG was exported from Cheniere’s Sabine Pass terminal in Louisiana.17 The U.S. had previously exported LNG only in relatively small quantities from a facility in Cook Inlet, Alaska.18 Gas exports via pipeline to Mexico grew 460 percent in this period, from less than 1 billion cubic feet per day (cf/d) to over 5 billion cf/d. By 2019, total exports had soared to over 9 billion cf/d, an 800 percent increase from 2010 (Figure 5). The U.S. also exports gas via pipeline to Canada, but imports more than it exportsIn 2025, the U.S. exported around 1 Bcf/d to Canada and imported around 3.1 Bcf/d. See Export and Import data by country at https://www.eia.gov/naturalgas/data.php.. Therefore, exports to Canada are not included here. During this period, the average Henry Hub price was $3.31/MMBtu. From 2016 to 2019, when LNG exports ramped up, the average was $2.81/MMBtu, indicating that supply was able to keep pace with the surging demand for exports.19

Figure 5

Gas, LNG, Our Climate, and Environmental Justice

Communities near LNG export facilities are exposed to harmful air pollutants, including nitrogen oxides (NOx), particulate matter, and hazardous compounds (toluene, benzene, etc.), which are known to cause cancer, respiratory illness, cardiovascular disease, and birth defects with prolonged exposure.21 U.S. LNG export terminals primarily impact Black, Brown, Indigenous, and low-income communities in the U.S Gulf South. In their report “Permit to Kill,” Greenpeace and the Sierra Club estimate that air pollution from currently operating LNG export terminals causes 60 premature deaths and $957 million in total health costs per year.22 If all the planned LNG terminals and expansion projects are built, those numbers would increase to 149 premature deaths and $2.33 billion in health costs per year.

Gas is a fossil fuel and a major contributor to the extreme climate events impacting communities across the world – disproportionately in the Global South – every day. The extraction, processing, transportation, and distribution of gas pollutes our atmosphere with methane, a highly potent greenhouse gas that is the main component of fossil gas.23 While the industry has made lofty pledges and technology companies claim to have solutions,24 the IEA reported in May 2026 that “there is still no sign that methane emissions from fossil fuel operations are falling.”25 Producing LNG from gas amplifies these emissions.26 LNG plants are gas consumers, requiring on average 14 percent of the liquefied volume for process use.27 LNG displaces renewable energy in the market and drives up emissions.28

The 2020s – Pandemic, War, Volatility, And Inflation

In 2020, the COVID-19 global pandemic led to widespread lockdowns and a decline in economic activity. This, in turn, led to shut-ins of oil and gas production in the U.S. and elsewhere. However, this was relatively short-lived. U.S. gas production declined only 0.4 percent year-on-year in 2020, following double-digit growth in the two years prior. While U.S. LNG exports were curtailed from April to August 2020 due to prices in Asia and Europe falling below variable costs,29 total exports grew year-on-year by an astounding 34 percent, as new LNG terminals brought online in 2019 ramped up production. As the U.S. and global economies reopened following the adoption of vaccines and the end of lockdowns, LNG exports soared and domestic demand for gas and electricity also started to grow. By late 2021, as Russian President Putin was preparing his full-scale invasion of Ukraine, the strain on oil and gas supply was making itself felt via spiking energy prices.

As the full-scale invasion of Ukraine in February 2022 triggered a major pivot in Europe from Russian pipeline gas to LNG imports, U.S. LNG exports soared nearly 70 percent from 2020 levels (see Figure 1). Together with exports to Mexico, over 16 percent of U.S. gas production was exported in 2022. U.S. prices for gas and electricity spiked on top of rises already seen in 2021. While wholesale prices declined in 2023 and 2024, they climbed again in 2025. As Figure 6 shows, residential price movements are smoother than those of other sectors but still follow the general upward trend.

Figure 6

Soaring exports and domestic prices

From 2020 to 2025, U.S. LNG exports grew by nearly 150 percent, while pipeline exports to Mexico grew by over 20 percent. By 2025, U.S. gas consumption was up a modest 8 percent from the 2020 COVID-19 dip. Utility gas and electricity prices rose above the average inflation rate, despite a significant 2024 dip in wholesale gas prices (Figure 7).

Figure 7

Throughout this period, energy affordability became a major issue for U.S. households. A poll released in April 2025 found that 73 percent of Americans were concerned about rising electric and gas utility bills.32 An accompanying analysis of 2024 U.S. Census Bureau data estimates that 80 million Americans, around a quarter of the population, are struggling to pay their utility bills. Yet, these rising gas and electricity bills happened during a time of historically low production costs for U.S. gas.

Meanwhile, the oil and gas industry became more focused on profitability. From 2020 to 2025, gas production rose 16 percent. This was almost half the growth rate between 2010 and 2019. While fracked oil and gas production soared in the decade leading up to 2020, profits were scarce due to a focus on growth at any cost and the resulting downward price pressure of oversupply. An industry reset followed the 2020 crash. Pressure from investors to deliver returns focused the industry’s attention on improving efficiency and yield, which manifested in greater efficiency and slower production growth.33

In 2025, as the Trump administration made “winning the AI race” a national strategic priority,34 the specter of massive growth in data center energy demand moved to the forefront of the energy affordability debate. In early March 2026, Trump signed a “ratepayer protection proclamation” claiming that agreements with seven technology companies would protect ratepayers from increases caused by the massive buildout of data centers and the energy infrastructure required to fuel them.35 Details were lacking. An analysis by Inside Climate News highlights many of the issues at stake, including how data centers looking to power their facilities directly with off-grid gas power plants will be competing for fuel with on-grid plants, potentially raising prices for everyone.36

As we will see below, the push for data center expansion is triggering a massive increase in proposals for gas power plants, and projections of future gas demand for U.S. power generation are rising. Even as regulators grapple with rules to prevent data center energy infrastructure costs from being passed on to ratepayers, the cost of generating electricity with gas may have to rise for everyone, simply due to the pressures on supply to meet burgeoning demand.

What’s the Relationship Between the Wholesale Cost of Gas and Households’ Gas Bills?

The cost of gas is the largest single factor behind the price you pay for household gas. Households’ gas bills also include state and local taxes and the cost incurred by utilities to deliver gas to homes and maintain infrastructure.37

The cost of gas made up 31 percent of the amount families saw on their gas bills in 2023,38 when wholesale prices were below average.39 When the cost of gas rises, it accounts for a larger share of households’ gas bills, since the other components remain relatively steady.40

While it is too simple to say that doubling the wholesale price of gas means households’ utility bills will double, if wholesale gas prices rise in line with this report’s projections, families' energy bills will rise.

The End of Cheap U.S. Gas

While the 2010s were marked by surging production outpacing demand, the coming decade is expected to see the opposite. U.S. gas production may struggle to keep up with demand growth in the coming years if demand for exports and power generation surges to the levels implied by industry investments and current policies, and as U.S. shale basins mature. The Trump administration’s policies, focused on maximizing fossil fuel production and exports while undermining renewable energy, are encouraging rising investments in gas infrastructure and driving up U.S. gas demand forecasts. Trump’s “energy dominance” agenda seeks to promote and support fossil fuels and constrain renewable energy. In a February 2026 press release, the White House boasted of “record-breaking LNG Exports,” opening federal lands to oil, gas, and coal production, a surge in drilling permits, “revitalizing beautiful, clean coal,” and withdrawing from the Paris Agreement on Climate Change, among other things.41

The Trump administration brought a swift end to the Biden-era pause on new LNG export approvals soon after taking office. The subsequent fast-tracking of new permits led to a surge in FIDs for new LNG capacity in 2025. Together with capacity that was already under construction, this could lead to a doubling of U.S. LNG exports, already the world’s largest, by the early 2030s.

In addition, the administration’s determination to win the “race to achieve global dominance in artificial intelligence” is dramatically increasing electricity demand amid an unprecedented build-out of energy-hungry data centers.42 Combined with the administration’s attacks on renewable energy, data center expansion is expected to increase gas demand for electricity generation, adding to the pressure asserted by surging LNG exports on U.S. gas production.

Industry analysts broadly agree that, for production to meet this surging demand, higher wholesale gas prices are needed to incentivize drilling in areas with high breakeven costs. As the Trump administration attempts to kill affordable renewable energy, promote fossil fuels as if they were a limitless resource with no externalities, and promote energy-guzzling industries such as cryptocurrencies and AI, the administration is steering the U.S. toward a future of high energy prices, relentless pollution, and climate chaos.

Trump policies are maximizing demand for U.S. gas

The Trump administration’s policies are stoking U.S. gas production to feed exports and to meet rising domestic demand at unprecedented levels. The bulk of new demand for U.S. gas is set to come from LNG exports. Projected power demand from data centers is the next-largest contributing factor, while exports to Mexico are expected to grow modestly. The Trump administration’s attacks on renewable energy reduce options for meeting surging electricity demand from data centers, adding unnecessary pressure.

LNG exports

As the Trump administration lifted the previous administration’s pause on new LNG export authorizations, companies rushed to announce FIDs on new LNG export capacity. According to the International Energy Agency (IEA), in 2025 alone, a record 66.8 mtpa (8.8 billion cubic feet per day [Bcf/d]) of new export capacity reached FID. So far in 2026, an additional 22.9 mtpa (3 Bcf/d) has reached FID, bringing the total export capacity greenlit since Trump took office to 89.7 mtpa (11.8 Bcf/d). All of this is expected to come online by 2031 (See Table 1).

When this capacity is added together with projects that were ramping up LNG production at the beginning of 2026, 153 mtpa (20.2 Bcf/d) of new U.S. LNG capacity is expected online by 2031, according to the IEA’s figures. For context, at the end of 2024, global LNG capacity was 494.4 mtpa.43

Table 1

Total U.S. LNG export baseload capacity will reach just over 225 mtpa (31 Bcf/d) when all currently commissioning and under-construction facilities come online, which is expected by 2031.44 Peak nameplate capacity in this period will hit 283 mtpa (37.7 Bcf/d) according to the EIA.45 This surge in newly approved and financed U.S. LNG export capacity drives the expected surge in exports and associated gas production in projections used in this report. Both Rystad Energy and BloombergNEF (BNEF) expect this capacity to be utilized at a high rate, thereby driving the expansion of U.S. gas production in costlier areas (see below).

These projections are not set in stone. They reflect a future in which gas production and use continue to grow, which is wholly incompatible with internationally agreed climate goals. They can change in response to both policy and market developments, and actual exports could be higher or lower. But based on existing policies and investments, these analysts do not currently see a significant pivot away from gas in global markets, as indicated by projections for U.S. exports that track closely with expanded capacity. Rystad’s U.S. LNG export projection, shown in Figure 8, even includes the approval of additional capacity that is yet to reach FIDRystad has Delfin LNG as yet to reach FID, which contradicts the IEA’s tracker. Also included by Rystad in yet-to-FID is Sabine Pass Train 7, Texas LNG Trains 1 & 2, and Jordan Cove Train 2. Excluding these projects from the Rystad projection results in exports peaking at around 31.5 Bcf/d.. Rystad’s current projection suggests that U.S. LNG exports could grow to around 33.5 Bcf/d in the late 2030s, which would account for close to 25 percent of expected total U.S. gas production, up from around 14 percent in 2025. It should also be noted that these projections do not include gas consumed in the liquefaction process, which the EIA estimates at 14 percent of export volumes.46 Therefore, a greater proportion of U.S. gas production than these numbers suggest will potentially be dedicated to the LNG export trade.

Figure 8

Exports to Mexico

U.S. gas exports to Mexico are expected to keep rising, but at a slower rate than in the past decade. A proportion of these pipeline exports is slated to feed LNG export plants on Mexico’s west coast.47 By 2040, pipeline exports to Mexico are projected to reach 8 Bcf/d (Figure 9). Together with LNG, the U.S. could therefore be exporting over 41 Bcf/d, almost 30 percent of projected production, up from 20 percent in 2025.

Figure 9

U.S. domestic demand growth

In April 2025, EIA published its Annual Energy Outlook (AEO) 2025.48 The modeling was conducted in 2024, based on existing policies in effect at the end of that year. The projections for U.S. fossil gas consumption in the report’s reference case showed an overall 11 percent decline from 2024 to 2050, while gas use in the power sector was expected to fall by 38 percent over the same period.49 It should be noted that while these projected declines were in the right direction, they fell far short of what is needed for the U.S. to achieve the goals of the Paris Agreement. In other words, stronger policies for phasing out gas are needed to meet climate goals.

The new administration’s Department of Energy, led by former oil industry CEO Chris Wright, released a statement that all but disowned the AEO 2025, stating that, in its view, the AEO 2025 “reflects the disastrous path for American energy production under the Biden administration.”50 This aligns with the Trump administration’s onslaught of attacks on wind and solar energy since day one. In the first 10 months of 2025 alone, the administration took 23 actions targeting wind and solar energy in the United States.51 These ranged from illegal stop-work orders on offshore wind construction to canceling a loan for one of the nation’s most important grid expansion projects, the Grain Belt Express, that would have helped transmit wind and solar energy across the Midwest. Perhaps the most impactful was the passing of the One Big Beautiful Bill Act (OBBBA) in July 2025. The bill slashed tax credits for renewable energy and raised tax breaks for fossil fuels, including for gas.52

In April 2026, the EIA released the AEO 2026.53 It contains the first EIA projections for U.S. energy supply and demand under the Trump administration’s policies, including the impacts of the OBBBA. The differences between the projections for gas use by 2050 in AEO 2026 and those in AEO 2025 are stark (Figure 10). The AEO 2026 projects that power sector gas consumption in 2050 will be double that projected in the AEO 2025. Rather than the 34 percent decline in power-sector gas burn (2025 to 2050) projected by AEO 2025, AEO 2026 projects a 31 percent increase. For total gas consumptionTotal gas consumption excludes the gas consumed by the oil and gas industry in its oil and gas field and LNG operations., the AEO 2026 projects a 16 percent rise by 2050 compared to the 10 percent decline projected in the AEO 2025.

Figure 10

Focusing on the power sector, where most of the increase in gas consumption between the two reports occurs, the AEO 2026 projects slightly lower total power generation than AEO 2025, but much more of that generation is provided by gas rather than renewable energy. Renewable energy still overtakes gas in the early 2030s, but its growth through to 2050 is far less dramatic than projected in AEO 2025 and is essentially matched by growth in gas-fired generation (Figure 11). Coal declines slightly slower in AEO 2026 than in AEO 2025, while nuclear energy is about the same.

Figure 11

The changes between these AEO reports are not the only signs that the Trump administration has likely changed the trajectory of gas and renewable energy consumption in the U.S. In early July 2026, the energy industry data and analysis firm Wood Mackenzie published a report entitled “Defying Gravity: Why Henry Hub Natural Gas Prices are Set to Rise.” The report cited data center demand as the key driver of a potential 50% rise in gas demand in the U.S. power sector.56 The shift is also evident in the sharp increase in planning applications filed by utilities and other companies looking to build new gas-fired power plants in 2025.

Proposed gas power plant capacity soars in 2025

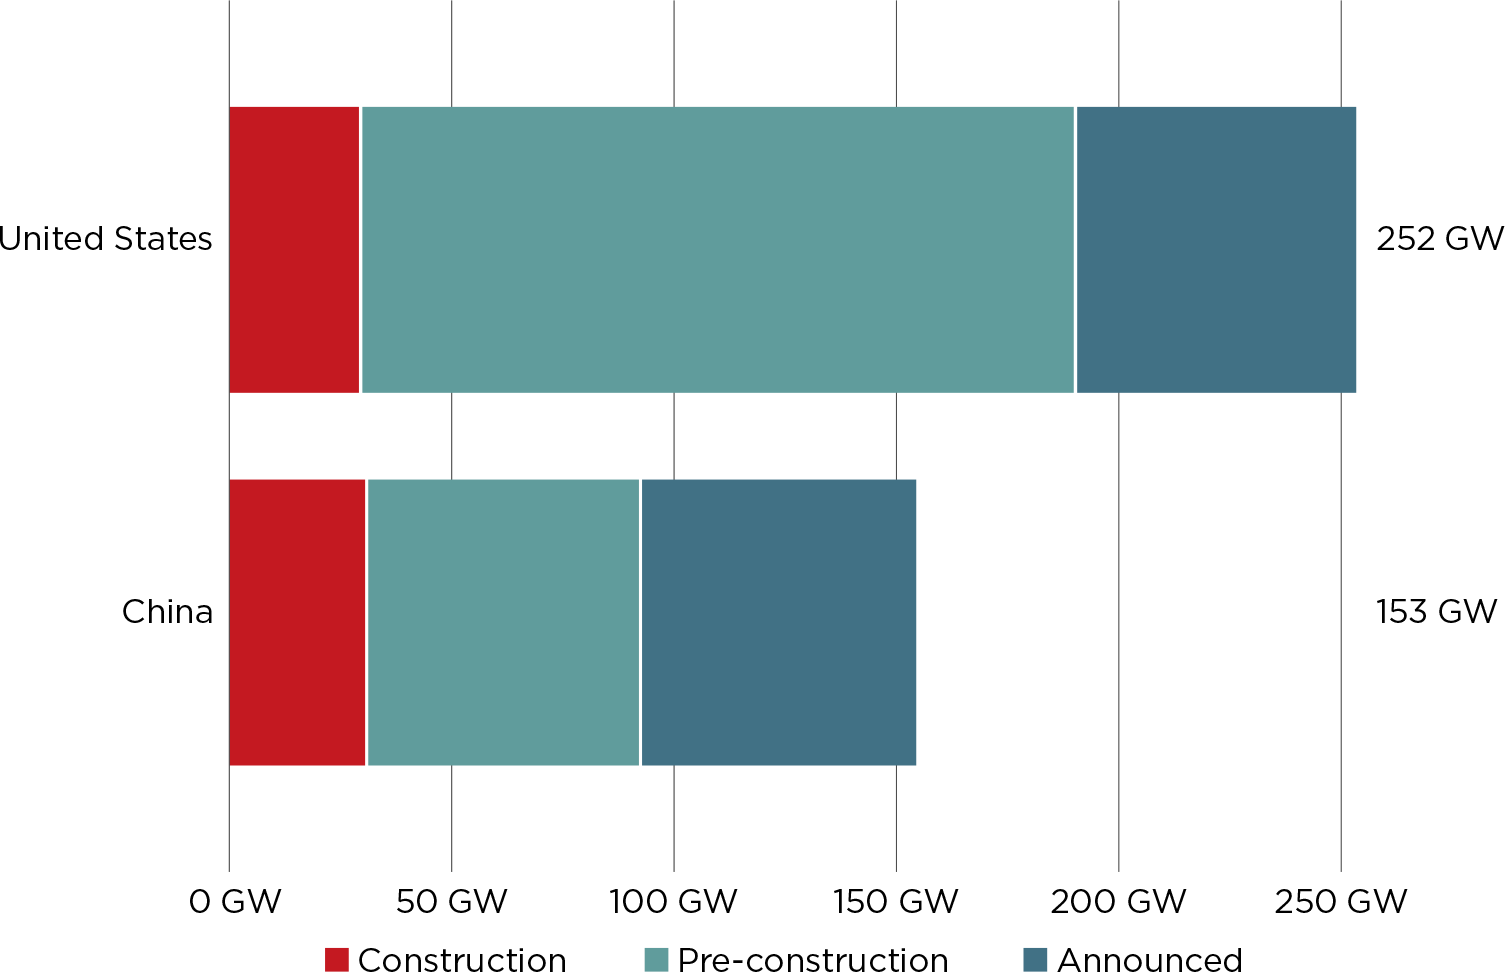
The Trump administration’s support for fossil gas and energy-hungry AI is evident in the tripling of proposed gas-fired power plant capacity that occurred in 2025. According to Global Energy Monitor (GEM), U.S. gas power plant capacity in development grew in 2025 from 85 gigawatts (GW) to 252 GW  (Figure 12). This massive jump pushes the U.S. ahead of China and all other countries for planned gas power capacity. GEM calculated that “if all in-development plants are built, the U.S.’ existing gas fleet would grow by nearly 50 percent, at an estimated cost of over $416 billion.”57

Figure 12

Global Energy Monitor Data on Planned Gas Power Plants in the U.S. and Globally

Source: Global Energy Monitor58

Of this 252 GW of planned gas power capacity, 30 GW, around 12 percent, is under construction, while 159 GW, 63 percent, is in pre-construction.59 The remaining 25 percent is announced with no clear timeline for moving forward. If all of this capacity were built, it would represent a nearly 40 percent increase in gas-fired capacity over 2024 levelsThis calculation factors in planned retirements of existing capacity. EIA data for planned retirements uses “Net Summer Capacity,” so GEM’s nameplate capacity has been reduced by 13% to align with EIA figures. The net increase, after planned retirements and using net summer capacity, is 39%. Based on “Table 4.3: Generator Nameplate Capacity” and “Table 6.6: Planned U.S. Electric Generating Unit Retirements,” in EIA, Electric Power Annual, accessed June 30, 2026..

Over a third of the planned gas power capacity tracked by GEM is slated to directly power data centers on site, independent of the grid. This is known as behind-the-fence or behind-the-meter generation. GEM also states that “many more on-grid projects are planned to meet an anticipated increase in energy demand from AI.”60 The EIA’s AEO 2026 projects that electricity demand for data centers will more than triple by 2050 from 2025 levels, and cites data center demand as a “major factor” in projected annual electricity demand growth of between 0.9 and 1.6 percent over that period.61 However, no figures are provided for how much of this would be met by gas.

Data center gas demand

While there is much discussion of the electricity demand spike that data center expansion will cause, we found few explicit estimates of how much additional gas demand it could trigger. One article by analysts at the financial information and analytics firm S&P Global projected a range of 3 to 6 Bcf/d of additional gas demand for data center power generation by 2030.62 This was produced using a simplified model, and the analysts argued that it presented significant opportunities for gas pipeline companies to grow their businesses. Six Bcf/d is nearly 17 percent of U.S. power-sector gas demand in 2025.63

The high end of the S&P Global estimate roughly corresponds with a more detailed analysis from BNEF. In a November 2025 report, BNEF presents its estimates of gas demand for U.S. data centers through 2035.64 The projection estimates an additional 5 Bcf/d of demand by 2035, growing from nearly 1.8 Bcf/d in 2025 to 6.8 Bcf/d (Figure 13). The projection sees the bulk of growth occurring in the eastern U.S. region.

Figure 13

BNEF notes that much of this growth will take place by 2030, as will much of the growth in LNG exports. The analysts estimate that 19 Bcf/d of new gas supply is required to meet demand from LNG exports and data centers from 2025 to 2030, and that “gas prices may need to rise to incentivize more production.”66 The timing of this growth contrasts with the EIA’s AEO 2026 projection of U.S. power sector gas demand (Figure 10), in which demand flattens and declines until the early 2030s, then rises steadily through 2040. However, BNEF’s conclusion that rapid growth in both LNG export demand and data center-driven gas power demand could strain U.S. supply, leading to higher prices, aligns with the analyses of both Rystad Energy and Wood Mackenzie.67

Government and private-sector analysts alike project a dramatic increase in demand for U.S. gas over the coming decades under current policies and market conditions. These can change, and these projections may turn out wrong. While the energy crisis triggered by the war in the Persian Gulf is driving some countries and companies to move faster toward renewable energy and away from fossil fuels, it is driving others toward diversifying fossil fuel supply away from the Persian Gulf, in some cases toward the U.S. and the rest of the Americas.68

The amount of LNG export capacity under construction indicates that LNG could be the largest driver of a surge in demand. However, rising demand for electricity to power burgeoning data centers in the “AI race,” coupled with federal policy hostility toward renewable energy, also puts pressure on the oil and gas sector to produce more. Many of the LNG plants and data centers driving this growth in demand are expected to be built over the next five to ten years. At the same time, the fracking boom that has underpinned gas supply growth and the related LNG export boom is entering its third decade. The next 30 to 35 percent growth in gas supply may not be delivered as cheaply as the last.

Meeting surging demand for U.S. gas will require costlier gas

BNEF projects a 19 Bcf/d surge in demand by 2030 from LNG exports and data center growth alone.69 Incorporating growth in exports to Mexico and from other sectors of the U.S. economy, Rystad projects production growth of over 24 Bcf/d by 2030 compared with 2025, rising to 37.5 Bcf/d by the late 2030s. This would amount to a further 35 percent increase in U.S. gas production between 2025 and the late 2030s. Wood Mackenzie sees 17 Bcf/d of additional gas demand in the power sector by 2035.70 All three firms suggest that meeting such high production rates will require higher gas prices to incentivize companies to drill in costlier gas fields. In this section, we will examine the extent of the required price increases and what is driving them.

The big picture

In the past decade and a half, rising demand for U.S. gas was generally comfortably met by a surge in production. In the coming decade, as LNG exports are set to double and domestic demand rises to power the data center boom, U.S. gas production may need to literally dig deeper to meet demand, leading to rising production costs.

This is indicated by Rystad Energy’s analysis of the projected “breakeven price” of producing U.S. gas through 2040. The breakeven price is the minimum price at which a company can cover its costs and turn a profit on each unit produced. We find that meeting expected demand growth will require wholesale gas prices to remain significantly higher than they have been since the production boom took hold.

In Figure 14, it is clear that gas that requires less than $2 per thousand cubic feet (mcf) to break even in Rystad’s analysis begins an abrupt decline in 2026. This is primarily because of the steep decline rates of fracked wells. Most, if not all, of the gas in that bracket is being produced today; the wells are already drilled, so costs are sunk, and the breakeven price of continued production is low. It is the breakeven price of drilling new wells, not only to replace the decline of today’s producing wells but also to meet the surge in demand expected over the next decade, which is significant in shaping future prices.

The price bands in Figure 14 indicate that, for U.S. gas production to keep growing beyond 2030, prices must rise above $4/mcf. Gas production requiring prices above $4/mcf to break even is forecast to rise from 4 percent in 2025 to close to 20 percent of production by the late 2030s. While this is a modest percentage of overall gas production, it is the most significant factor for future gas prices. The growth of the $4/mcf price band is likely to disproportionately influence gas prices as this is the cost of marginal supply.

As demand grows, it is not the average cost of production that necessarily exerts the most influence on prices, but rather the cost of meeting the next increment of demand growth. From the early 2030s onward, it is not only gas in the $3-4/mcf price band that expands, but the last increments of demand growth are expected to be met by gas that requires prices of $4/mcf or higher to be brought online. This implies that wholesale prices will need to remain at this level to incentivize enough gas production to meet rising demand. The implication is that the breakeven price of the “marginal source of supply,” the supply source that is brought online to meet the last increment of demand growth, is significantly higher than the average wholesale price over the last ten years ($3.30/mcf)Gas is traded in MMBtu. The average Henry Hub price from 2016 to 2025 was $3.18/MMBtu. We converted this to Mcf to align with the breakeven price analysis in Figure 14. One thousand cubic feet of gas is 1.037 MMBtu. Therefore, the average price in Mcf was $3.30..

Figure 14

Projected U.S. Gas Production by Breakeven Price

Broad consensus on the need for higher prices

Rystad analysts are not the only ones seeing these changes. A broad range of industry analysts are also sounding the alarm about the pressures from rising demand for U.S. gas and the implications for prices. For example, analysts at Wood Mackenzie recently wrote that “we believe Henry Hub is now entering a new era (…) as gas demand surges across the power, industrial and LNG export markets.”71

BNEF, an energy analytics firm focused on the energy transition, raised the issue in a September 2025 Gas Market Outlook report, subheaded “Rapidly growing U.S. gas exports pose a significant threat for supply.”72 The report focuses on BNEF’s projected supply and demand balance through 2030 and warns that, each year until 2030, total demand, including exports, will exceed supply (Figure 15). As demand fluctuates throughout the year, imbalances are addressed through a net withdrawal of gas from storage. This tends to lead to higher prices as traders monitor storage flows as a key indicator of supply and demand dynamics, and prices generally rise when storage falls below seasonal averages.

The authors note that at the time of writing, futures contracts up to 2030 for gas trading at the Henry Hub were on average priced below the marginal supply cost, which they estimate at $3.60/mcf.7374 This means the current price traders are paying for future gas delivery at the Henry Hub may not cover the cost of delivering that gas when the time comes. This does not necessarily mean that producers or traders will take a loss on that gas. More likely, the price of these future gas contracts will rise as they approach the delivery date (See Box).

Gas Futures Prices are a Poor Indicator of Long-Term Pricing Trends

Futures are contracts traded on exchanges that represent a commitment to buy or sell an asset at a specific price at a specific future date. Contracts for trading fossil gas at the Louisiana Henry Hub are traded on the New York Mercantile Exchange and managed by CME Group.75 The Henry Hub futures contract is the third largest physical commodity futures contract in the world by volume.76 Some reviewers of this report noted that current Henry Hub futures prices do not align with the Henry Hub price forecasts shown in Figure 21. At the time of writing (late June 2026), contracts for delivery in the 2030s were generally priced between $3 and $4 per MMBtu, with prices approaching $5 in the winter months.77 These prices are not significantly higher than recent seasonal prices. 

However, futures contracts are poor indicators of pricing trends beyond a few months. They are generally calculated based on the spot price, which is the price of buying the commodity for immediate delivery, plus the cost of holding the asset until delivery, which includes storage and interest rates. This generally reflects the cost of financing the trade rather than predictions of future long-term prices. Beyond a few months, the price of futures contracts is a diminishing indicator of the commodity's value. This is reflected in the diminishing volume of contracts traded for dates beyond a two-month horizon. For example, at the time of writing, the estimated number of contracts settled for August 2026 was 210,000. For December 2026, it was 21,000. The volume of contracts settled for delivery in January 2030 was seven. From March 2031 up to the latest date for which prices are available (December 2038), zero contracts were settled.78

While the BNEF analysts do not offer a forecast for Henry Hub prices, they note that “Henry Hub prices could rise to counter the expected imbalance.”79 They explain that, to meet rising demand, prices will need to rise to stimulate increased production in the Haynesville shale basin in Louisiana and Texas. As we will see below, the Haynesville is widely seen as the marginal source of supply because while there is significant potential to increase production, drilling and fracturing wells in the Haynesville is more expensive than in other plays. As other sources struggle to keep up with rapidly rising demand, the analysts believe prices will have to rise enough to stimulate costlier production in the Haynesville.

Figure 15

The EIA wrote in January 2026 that it expected Henry Hub prices to rise 33 percent to $4.60 Million British Thermal Units (MMBtu) in 2027 due to supply struggling to keep up with rising demand from LNG exports.81 The article did not look beyond 2027 because the analysis was based on the Short-Term Energy Outlook, which covers the current and following years. The authors noted that, “As natural gas demand outpaces supply, we expect storage inventories will gradually move below the rolling five-year average over our forecast. (..) Periods with higher-than-average inventories are generally associated with lower prices, while lower storage levels correspond with higher prices and tighter market conditions. As inventories move closer to or below the five-year average, our forecasted price for Henry Hub rises, illustrating how storage levels remain a key indicator of natural gas market balance and price formation.”82

Both the EIA and BNEF point to a higher-price environment in the medium term as supply struggles to keep up with surging demand, resulting in storage falling below seasonal averages, a key factor in the formation of wholesale prices. Rystad’s long-term analysis suggests that refilling storage in the 2030s will require higher prices than we have seen in the past, indicating that even as supply catches up to rising demand, the price floor may be higher than before.

A supply surge depends on three key regions – one of them drives prices higher

U.S. gas production is currently dominated by two key geological basins. The Appalachian Basin, primarily in West Virginia and Pennsylvania, and the Permian Basin, shared by New Mexico and Texas. Together, these two basins produced nearly 55 percent of U.S. gas in 2025. Besides being on opposite sides of the country, these basins differ fundamentally in their drivers of gas production. In Appalachia, the main product is gas. It is the economics of gas that drives drilling and investment in the basin. While some liquids are produced, mostly condensate and natural gas liquids, there is very little crude oil in the Appalachian Basin. In the Permian, crude oil dominates.

While these two basins are expected to produce more gas relatively cheaply, they cannot meet all the growth in demand anticipated in the coming years. The data presented below projects that while the Permian and Appalachian basins will supply some additional gas at relatively moderate, albeit increasing, prices, it is the Haynesville in East Texas and Louisiana that is expected to fill the gap. As the Haynesville requires higher prices to stimulate significant production growth, the gas price will need to rise for producers there to deliver.

The Permian Basin: Growth primarily depends on oil prices

The Permian Basin, which straddles northwestern Texas and southeastern New Mexico, is one of the world’s largest oil-producing basins, but it also contains vast quantities of gas and gas liquids. Gas produced in the Permian is considered “associated gas” because the gas generally comes from wells that primarily produce oil. Therefore, oil prices are the primary driver of gas production in the Permian. Despite this, the Permian Basin produced 21 percent of U.S. gas in 2025.

Prior to the war launched by Israel and the U.S. against Iran in late February 2026, oil prices were expected to remain low through 2026 and into 2027, at between $50 and $60 per barrel.83 This was expected to slow the rate of oil production growth in the Permian. As production from oil and gas wells in U.S. shale basins typically declines steeply from the peak rate achieved shortly after initial production, maintaining production at a steady level still requires drilling many wells. Most companies expected to implement a drilling program in 2026 simply to maintain existing production rates rather than increase production.84 This is known as “maintenance mode.” This had not significantly changed at the time of writing: Producers remain cautious about the longevity of higher oil prices caused by the war and continue to focus on delivering profits to shareholders and investors.

As oil production declines in older wells, associated gas production often declines more slowly. If most Permian Basin operators remain in maintenance mode in 2026, gas production could still grow. However, a substantial increase in gas production would require higher oil prices to stimulate drilling more oil wells.

In Figure 16, projected Permian Basin gas production is shown by breakeven price bands for both gas prices and oil prices. The gas price projection is based on oil prices converted to gas equivalents, since the Permian is an oil basin and decisions to drill new wells are primarily driven by oil prices. Production from oil wells that require $40 a barrel or less to break even are in decline. At prices of $40 to $50 per barrel, production could remain above 2025 levels. For gas production to reach its expected peak in the Permian in the late 2030s, oil prices will need to be above $60, with the last increment coming from wells requiring $70 per barrel or more. In gas price equivalents, 12 percent of all gas produced during this period breaks even at over $4/mcf.

These are not particularly high prices, and, in and of itself, the oil price required to raise gas production in the Permian is not a key factor driving national prices up. Permian gas production is expected to grow by 10.6 Bcf/d from 2025 to 2040, based on Rystad’s current oil price projections. Yet this is only enough to meet a little over 30 percent of the expected growth in demand for U.S. gas in the coming years.

Figure 16a

Figure 16b

The Appalachian Basin: Cheap gas far away from the Gulf Coast LNG export center

The Appalachian Basin is primarily a gas basin with production concentrated in southwestern and northeastern Pennsylvania, northwestern West Virginia, and eastern Ohio. In 2025, it produced 33 percent of U.S. gas, the largest share of any region. In recent years, growth has been relatively flat due to pipeline constraints and stagnant demand within the basin. However, that is expected to change. A number of new gas-fired power plants are being planned in the region, many of which are slated to power data centers. In addition, some new pipeline capacity is expected to come online, primarily via expansions and extensions of existing pipelines.

The basin is expected to produce around 7.3 Bcf/d more gas in 2040 than in 2025. As elsewhere, production in the $2/mcf and below price bracket is expected to steeply decline, falling from just under 80 percent in 2025 to 12 percent in 2040. Production in the $2-3/mcf range grows significantly, but prices above $3/mcf will be required to drive expected production growth. By 2040, 34 percent of production will cost $3/mcf and above.

Figure 17

Appalachian gas remains some of the cheapest to produce in the country, even as costs rise. But only a limited amount of Appalachian gas can reach the Gulf Coast, where LNG export demand is soaring, due to the long distance and associated pipeline transport costs. Growth from the Appalachian and Permian basins is not expected to keep pace with the surge in demand spurred by the Trump administration’s support for gas. That will require a surge in gas production from a region with significantly higher costs.

The Haynesville: Large growth potential, but at a price

The Haynesville is located in western Louisiana and eastern Texas. In 2025, it produced just under 15 percent of U.S. gas, coming in third behind the Appalachian and Permian basins. Its location makes it attractive to LNG suppliers as pipeline connections are relatively short, and several LNG terminal operators, including one of the largest, Venture Global, have contracted pipeline capacity from the region. Japanese companies such as Mitsubishi,85 JERA,86 Osaka Gas,87 and Tokyo Gas88 have recently acquired Haynesville gas producers and assets as part of their strategy to own more of the U.S. LNG supply chain.

Rystad sees significant potential for gas production growth in the Haynesville, with its base-case projection showing production more than doubling from 2025 levels by the early 2030s, adding over 21 Bcf/d by the late 2030s.

According to Rystad’s analysis, for that high rate of growth to occur, gas prices will need to rise above $4/mcf, with prices over $5/mcf required for production to reach the projected peak of over 37 Bcf/d. In 2026, new wells can be added at between $2/mcf and $4/mcf. But by the early 2030s, most new production requires prices above $4/mcf. The last 2 Bcf/d of production growth in the 2030s requires prices of $5/mcf and above.

Figure 18

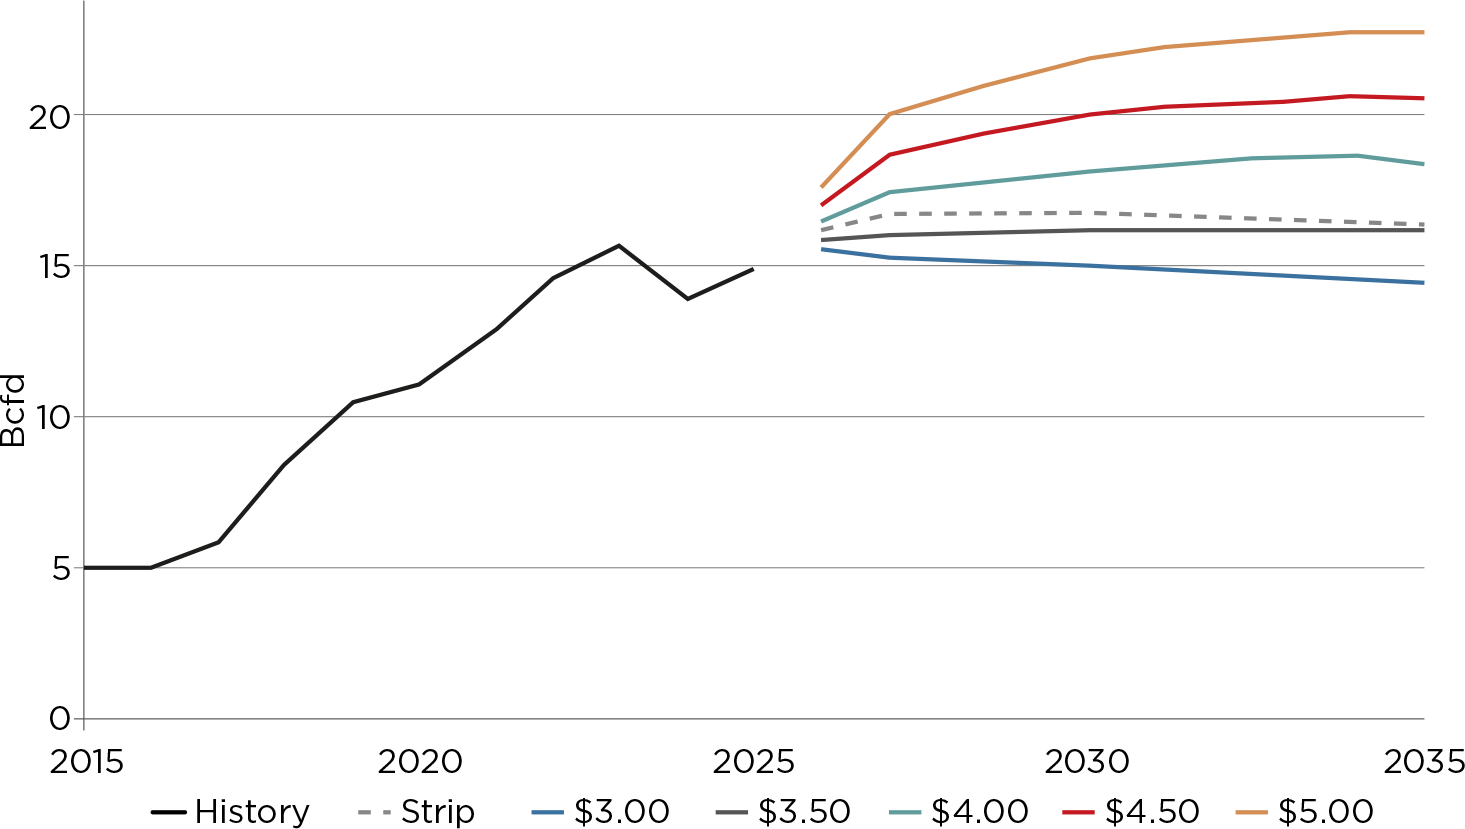
Other analysts see similar dynamics with Haynesville production. Amber Mccullagh, an analyst specializing in the U.S gas market, presented the chart shown in Figure 19 at a recent RBN Energy conference, showing that at current prices, Haynesville gas production would decline. Her analysis suggests that significant production growth requires prices above $4.50.89

Figure 19

Haynesville Production Scenarios

Note: strip refers to Henry Hub futures prices. It is clear that at the time the author created this chart, futures prices would not support sufficient production growth from the Haynesville. See the box above for why futures prices are not a good indicator of long term pricing.

Source: Measured Depth via RBN Energy90

In 2023, when U.S. gas prices declined from the highs that followed the supply crunch and market impacts of Russia’s invasion of Ukraine in 2022, the EIA published an analysis showing that lower gas prices would reduce the amount of gas that could be recovered from the Haynesville. It suggested that for significant production growth to be profitable, prices would need to reach $5-6/MMBtu.91

Deeper and costlier wells

The Haynesville’s higher costs primarily stem from the need to drill deeper wells and fracture them with high proppant intensity. Proppant is a mixture of sand and chemicals that is injected into fractures and forced into geologic structures to access oil and gas, propping open pores that would otherwise block the flow.92 It has to be transported to the well sites by hundreds of trucks. Higher proppant intensities raise costs. Rystad analysts have noted that Western Haynesville wells have the potential to be “twice as productive as the median legacy Haynesville well but triple the drilling and completion (D&C) cost.”93 They attribute this to well depths of at least 17,000 feet (5,180 meters) with “overpressured reservoirs and extremely high bottomhole temperatures.” Drilling such deep wells and managing these characteristics requires specialized and expensive well casings, raising costs. While analysts expect companies to find ways to reduce costs, the conclusion is that prices above $4/MMBtu are required to achieve significant production growth in the Haynesville.

All but one other gas-producing region will decline

While these three leading gas basins are expected to grow production by nearly 40 Bcf/d from 2025 to 2040, most other regions are expected to remain flat or in decline. The one exception is the Eagle Ford in Texas, which is expected to add about 3 Bcf/d by the mid-2030s, falling to 2.3 Bcf/d by 2040. This basin will require around $4 to $5/mcf to support growth in the 2030s. Figure 20 shows the growth expected across these four basins, along with the expected decline in the rest of the U.S. from 2025 to 2040. At the national level, U.S. gas production is projected to increase by 37.5 Bcf/d from 2025 to its projected peak production year (2038). The Haynesville, with its higher production costs, is expected to account for nearly 60 percent of this production growth at its peak. Without costly Haynesville gas, projected demand growth from LNG exports and rising U.S. demand is unlikely to be met.

Figure 20

Implications for U.S. Consumers

The looming surge in LNG exports, coupled with rising domestic demand for gas-fired power generation driven by data center expansion and exacerbated by the Trump administration’s hostility to clean, affordable renewable energy, creates the perfect storm for rising energy prices in the United States.

As LNG exports spiked after 2020, we saw gas and electricity prices rise above inflation. As reported by the nonpartisan consumer education nonprofit Powerlines, household gas costs have increased nearly 40 percent since 2019, and nearly 80 million people struggle to afford their electricity bills.94

Gas production costs are set to rise. If demand for exports and domestic use grows in line with existing industry plans, a rising share of production will have to come from the costlier Haynesville shale basin. Investment in the Haynesville will require rising wholesale prices.

Continued reliance on gas to meet rising electricity demand will likely lead to higher electricity prices, even as some states require data centers to pay their way. The Trump administration’s obsession with “energy dominance” and fossil fuels, and its hostility toward renewable energy, appears set to exacerbate an energy affordability crisis that is already hurting U.S. households.

In shale’s new era, producers chase profits over growth

As the U.S. shale boom enters its third decade, its maturity is evident in several ways. One factor that has already taken hold since the 2020 pandemic-caused crash is the move toward capital discipline, in which investment in production growth is managed to ensure profits and maintain dividends paid to investors.95

The first decade and a half of the shale boom were driven by a push for maximum production. Oil and gas production grew rapidly, outpacing demand growth, tanking prices, and resulting in low returns. By 2019, the industry’s financiers were pushing for restraint, seeking to reduce their exposure to the industry’s boom-to-bust cycles.96 Shale companies were increasingly pressured to prioritize investor returns over production growth. This move toward capital discipline has dominated the industry in recent years.97 This essentially means that producers are taking fewer risks and requiring strong signals that future prices will return profits from investment in production growth. This has been evident in 2026 as oil-focused producers have not yet made significant commitments to raise production in response to spiking oil prices, reflecting skepticism that higher oil prices will last.98

In light of this, it seems clear that gas producers will look for strong indications of sustained higher prices to support greenlighting investment in production growth. The wave of new LNG capacity coming online over the next five years provides a clear sign of rising demand. As we will see in the next section, analysts are forecasting a steady rise in gas prices, providing the signal producers may need.

Why Did the Henry Hub Price Remain Stable During the Crisis in the Strait of Hormuz?

The illegal war99 Israel and the U.S. launched against Iran in late February 2026 led to an abrupt increase in oil prices and in the price of LNG imported into regions such as Asia and Europe. While the oil price increase led to spikes in gasoline prices paid by U.S. consumers, U.S. fossil gas prices remained relatively stable. The blockade of Qatari LNG in the Strait of Hormuz, which shut in around 20 percent of global LNG supply, and the damage sustained by Qatar’s LNG facilities during the hostilities created a shortage of LNG in the global market. However, this did not lead to a significant increase in the Henry Hub price in the U.S.100

This was primarily due to two factors. First, the war coincided with warmer weather in the Global North, thereby reducing gas demand for heating in both the U.S. and most international markets. Second, most U.S. LNG plants were either already operating at close to their full production capacity or had a portion of their capacity offline for routine maintenance. Thus, U.S. exporters could not ramp up production in response to increased demand in Asia and Europe to an extent that would affect the supply-and-demand balance in the U.S. In addition, the northern spring is traditionally the time when LNG plants perform routine maintenance, and this takes a proportion of capacity offline, reducing the demand for gas for LNG production and increasing the supply available for domestic consumption, thus easing domestic prices.101 If the energy crisis had occurred when U.S. LNG plants had spare capacity to increase exports and demand for gas for heating or electricity generation was spiking, the impact on U.S. prices from additional exports to meet global demand would likely have been more dramatic.

Prices are forecast to rise

Both Rystad Energy and the EIA project Henry Hub prices to rise through 2040, though the EIA differs in its expectation for the early years of the forecast. We track these two projections in Figure 21 against the Federal Reserve’s inflation rate target of 2 percent. Inflation for 2026 is pegged at the pre-war February 2026 rate of 2.5 percent, then set at the Fed’s 2 percent target for subsequent years through 2040. While the EIA’s projection is lower than Rystad’s through 2030, it remains above the Fed’s inflation target and rises sharply after 2030.

There is no expectation of a return to the $3.18/MMBtu average price that endured from 2016 to 2025, the first decade of U.S. LNG exports.102 Most years see an increase that exceeds the Fed’s 2 percent inflation target. By 2040, the Rystad and EIA forecasts expect the Henry Hub price to be between $7.10 and $7.33, whereas a steady 2 percent increase would lead to a 2040 price of $4.76. The average price for 2026 to 2040 across the two forecasts is $5.74, which is 80 percent higher than the average for 2016 to 2025.

It should also be noted that these annual averages mask the typical seasonal fluctuations, with prices spiking in the winter due to heating demand and in the summer due to high power demand for cooling, as well as spikes caused by external events such as Russia’s 2022 invasion of Ukraine. Year-on-year changes can be much steeper. With increasingly erratic weather driven by climate change, it appears likely we will see steeper seasonal price spikes than this projection of annual averages indicates.

Figure 21

If the Rystad and EIA projections prove accurate, U.S. energy consumers can expect rising energy prices and possibly broader cost inflation, driven by higher gas costs for industries such as steel, paper, glass, and auto manufacturing, as well as higher heating costs for commercial buildings, including restaurants, stores, and hospitals. In addition, the continued reliance on gas as the leading source of electricity generation suggests that recent electricity price inflation is far from over. We have seen how, in the first full decade of the fracking boom, lower wholesale prices (Henry Hub) were accompanied by lower prices across the board of gas consumption. Electricity prices rose slightly, but below the rate of inflation. This was reversed after 2020. As wholesale prices soared, prices across the board rose, outpacing inflation (Figure 22).

Figure 22

Average Growth Rate for Gas and Electricity Price Compared with Inflation, 2010-2019 vs 2020-2025

Implications for LNG importers

The U.S. became the world’s leading LNG exporter in 2023 and is on track to double its exports based on 2025 levels by the early 2030s. U.S. LNG exports regularly flow to Europe, Asia, and Latin America. In 2025, U.S. LNG exports went to 45 countries; the top five were the Netherlands, France, Egypt, Spain, and the United Kingdom.105 As pressure on U.S. gas supply increases, the evidence above suggests that the average cost of U.S. LNG exports could rise by 80 percent over the coming decade.

Contracted LNG is primarily linked to rising Henry Hub prices

Most U.S. LNG export projects contract between 80 and 90 percent of their capacity via long-term Sale Purchase Agreements prior to gaining finance for building the project.106 The main exception to this is the Woodside Louisiana project in which Australian oil and gas giant Woodside sold equity stakes in the project, financing the rest itself and seeking to contract only around 50 percent of capacity.107

Most of these contracts use a pricing formula based on the Henry Hub price, plus a set liquefaction fee. The liquefaction fee is set per MMBtuOne thousand cubic feet of gas is 1.037 MMBtu. of gas and is typically a fixed cost in the contract, regardless of how much gas is bought. So, if a contract specifies one million tons of LNG per year, the contractor is committed to pay the liquefaction fee for that quantity of gas every year of the contract’s duration, even if they purchase less than one million tons in a given year. This is considered a fixed cost for LNG traders and is a significant factor in a trader’s decision to continue to lift cargoes when profit margins are squeezed.108

The price paid for the gas that is shipped with each cargo is generally indexed to the Henry Hub price at 115 percent.109 The 15 percent premium covers the cost of gas consumed by the LNG plant during liquefaction. This means that the cost of each cargo varies with the prevailing gas price at the time of purchase. If Henry Hub prices rise, so too will the cost of the gas to be liquefied. Together with liquefaction fees, these are the two cost components of an LNG cargo loaded at a U.S. LNG plant terminal. Traders and buyers also have to factor in shipping and regasification costs at the destination to arrive at the final cost of landing LNG and regasifying it for sale in the destination market.

Liquefaction fees are also rising

While the price of gas entering an LNG plant is expected to rise for the reasons discussed above, cost inflation is also expected to raise liquefaction costs at LNG terminals currently under construction. In March 2025, Reuters reported that several U.S. LNG producers were negotiating higher liquefaction fees for projects under construction or in the planning stage.110 Labor and materials cost inflation mean that the cost of constructing LNG plants today is significantly higher than in the past. High interest rates for financing were also cited. While some projects built before 2020 were contracted at liquefaction fees below $2/MMBtu, projects under construction today are locking in buyers at above $2.40/MMBtu, with some reports of prices as high as $2.90/MMBtu.111 In 2025, Venture Global reported selling cargoes on the spot market with liquefaction fees as high as $7.09/MMBtu.112

The demand on limited labor markets from the booming construction of data centers and oil and gas infrastructure is affecting the industry across the board, from drilling to pipeline and LNG plant construction. In March 2025, NextEra Energy’s CEO, John Ketchum, told a CERAWeek panel that “we have a real shortage of labor supply in this country,” referring to competition among data centers, LNG terminals, chemical companies, refineries, and the utility industry.113 The CEO of Chiyoda Corp, a Japanese construction company, cited a labor shortage on the U.S. Gulf Coast as a reason it was stepping away from contracts to build LNG terminals.114

Steel and aluminum prices are also a major factor in cost inflation for LNG terminals and other oil and gas infrastructure. Sergio Chapa, Senior LNG analyst at Poten and Partners, linked tariffs on steel and aluminum to liquefaction fees rising above $2.50, explaining that tariffs drive up the price of inputs. “Steel, aluminum turbines, compressors. Even though some of this equipment is made by American companies, they’re made overseas, and their imports and tariffs are due at the time of importation.”115

How will higher U.S. LNG costs impact global LNG markets?

The surge in U.S. LNG construction has led to expectations of a near-term oversupply in the global LNG market. Many market analysts and gas companies have expected this looming “glut” to lower LNG prices in importing regions. The March 2026 bombing of the world’s largest LNG plant in Qatar has likely delayed the expected glut and reduced the overall extent of any oversupply, as repairs are slated to take up to five years and planned expansions are also delayed.116 However, there remains the expectation that new LNG supply will keep prices low.117

U.S. gas and LNG executives have dismissed concerns about the impact of glut-driven low prices on their profitability, arguing that low prices will stimulate demand and therefore may not persist.118 The lesson for LNG importers is clear. Low prices will be temporary if demand catches up with supply. If the response to glut-driven low LNG prices is to greenlight new gas power plants or other long-term structural gas-demand infrastructure, the supply and demand balance will tighten, and prices will rise. In other words, rising costs being passed onto consumers in LNG-importing countries depends on one thing: locking in rising demand for gas.

The analysts at Rystad Energy, BloombergNEF, and the EIA, whose projections and analysis are covered in this report, currently expect that the vast surge in U.S. LNG export capacity currently under construction will be heavily utilized, based on the existing policy and market environment. This is likely based on data indicating that more than 80 percent of the capacity is contracted.119

While rising prices may help trigger policy responses to reduce LNG demand, there is a certain amount of lock-in as a result of capital invested in infrastructure and long-term contracts. The billions of dollars currently going into expanding LNG export and import capacity and building additional LNG tankers and gas plants to burn that gas120 suggest that market players expect these investments to pay off, and that consumers will bear the cost of increasing reliance on gas and LNG imports.

On the export side, it is generally not the LNG export plant owners or the gas producers that bear the financial risk; it is primarily the companies that contracted to buy the LNG, including traders (or middle men) and utilities in importing countries. These buyers will choose either to sell their cargoes at a loss or to bear the cost of breaking the contract, which essentially means paying for gas they do not load onto ships and sell into the market. On the import side, it is the capital invested in gas plants and import infrastructure by utility companies and others, both private and state-owned, that risks locking in demand for an increasingly costly commodity.

The findings of this report suggest that if importers increase LNG demand in line with expanding U.S. export capacity, they risk locking in high LNG prices due to rising U.S. gas production costs. This may impact the LNG market more broadly, given the increasing proportion of contracted LNG indexed to Henry Hub prices in the global market.

Henry Hub indexed contracts are set to dominate

The rising dominance of contracted U.S. LNG volumes in the market suggests that U.S. prices could become increasingly influential on global LNG pricing, even if other suppliers may be able to offer LNG at lower prices. LNG contracts linked to U.S. Henry Hub prices are set to become the majority of contracts in the market by the 2030s (See Figure 23). When large-scale U.S. LNG exports started in 2016, only 16 percent of global contracts were tied to Henry Hub prices. By 2025, this had risen to 35 percent. This will surpass 50 percent by 2033 and reach nearly 60 percent by 2035 (See Figure 23).

This essentially means that U.S. LNG will account for the largest share of contracted LNG supplies and will be the marginal supplier in the market, so for LNG demand to grow, it will need to be profitable for traders to trade U.S. supply. This implies a shift in where prices are set, from regional supply-and-demand fundamentals in destination markets such as Asia and Europe to the price of contracted U.S. LNG supply. Analysts from Rystad Energy highlighted this before war broke out in the Persian Gulf, when they wrote about what they termed “Henry Hub upside risks:”

As the U.S. becomes the marginal global LNG producer – potentially accounting for 35 percent of global LNG production by 2030 – the increase in Henry Hub index contracts mean that the price of TTF and JKM become more closely tied to, not only regional supply-demand fundamentals, but to the price of U.S. LNG contracts. Therefore, the cost of marginal LNG supply is bound to fluctuate with the price of Henry Hub, implying that a rise in Henry Hub will also lead to a rise in global LNG prices, as we’ve seen so far in 2026.121

Wood Mackenzie analysts came to the same conclusion, writing, “Internationally, as U.S. LNG is the marginal cost fuel, higher Henry Hub prices inevitably mean higher global LNG prices.”122

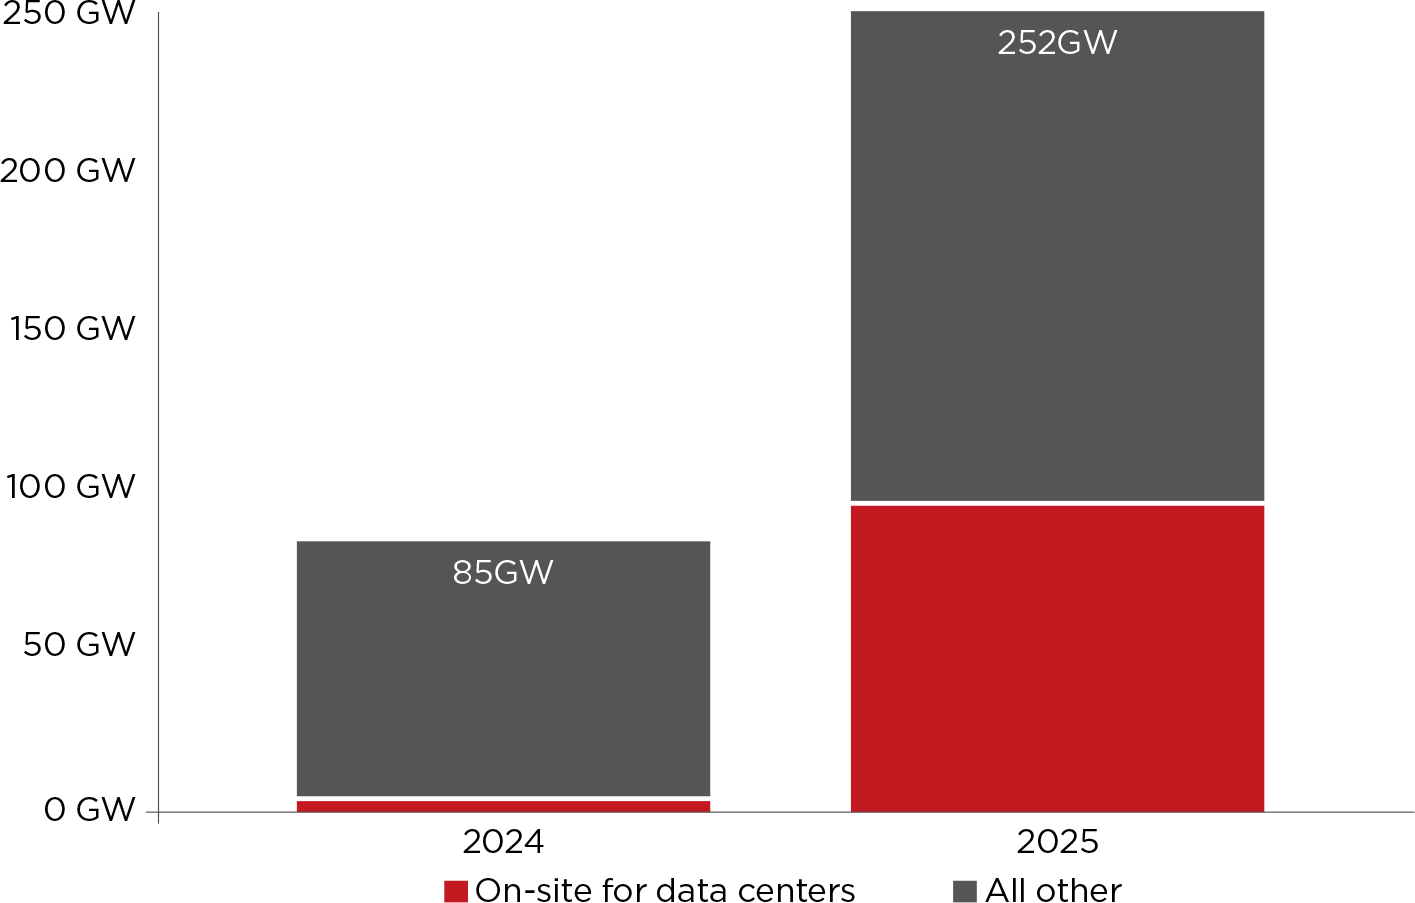
Figure 23

Conclusion & Recommendations

If industry succeeds in locking in unprecedented demand for U.S. gas by expanding exports and domestic consumption, U.S. supply may be pushed to its limits. Gas supply can only meet such high levels of demand if prices rise to cover the higher production costs of marginal gas supplies. This connects rising dependence on gas to rising energy costs. U.S. consumers and those in LNG-importing countries must push policymakers to reduce dependence on fossil fuels and accelerate the transition to reliable, affordable renewable energy.

  • Congress must stand up against the Trump administration’s hostility to affordable renewable energy, which raises costs for households in the U.S. and abroad by increasing reliance on limited fossil gas supplies.
  • U.S. political leaders must:
    • Cut fossil fuel subsidies and reinstate programs that support a just transition to renewable energy.
    • Support Data Center Moratoriums at the state and local levels to limit soaring gas demand and energy price increases for U.S. consumers.
    • Mandate agencies to stop the expansion of fossil fuel production. The U.S. Federal Energy Regulatory Commission (FERC) and the Department of Energy (DOE) should deny applications to build or expand LNG export facilities.
  • The governments of LNG-importing countries should accelerate the transition to renewable energy, setting specific goals to reduce gas demand as part of planned, government-led, binding roadmaps for implementing a fair, fast, full, and funded phase-out of fossil fuels.
  • Effective international cooperation is critical to making a fair phase-out possible for lower-income countries in the Global South that depend on gas imports or production. Other wealthy governments of the Global North, especially the EU and Japan, must counter the Trump administration’s backsliding and cooperate towards stable, affordable, and sovereign economies by:
    • immediately ending their public finance for fossil fuel projects, as laid out in multiple international agreements;
    • delivering their fair share of debt-free international public finance for a just energy transition;
    • backing changes to unfair economic rules that impede the ability of Global South countries to move beyond volatile gas dependence; and
    • resisting pressure from the Trump administration to spend billions on U.S. LNG and water down important legislation.

Acknowledgements
This report was researched and written by Lorne Stockman, with support from Camilo Rodriguez, Katharina Rall, Kelly Trout, Allie Rosenbluth, and Rebecca Stoner, all with Oil Change International.

We would like to thank the following for reviewing the text. Basav Sen at the Institute for Policy Studies, Jeremy Symons at Arc Initiatives, Tim Donaghy at Greenpeace USA, and Alan Zibel and Tyson Slocum at Public Citizen.

PDF design by [email protected]. Web design by Charlie Furellis.

Endnotes

  1. Rystad Energy UCube, accessed June 2026. The figure is based on “sales gas” or gas sold into markets, which does not include vast amounts of gas used as fuel in the oil and gas industry as well as flared and vented gas.
  2. Jacob Gronholt-Perdersen and Michael Perry, “U.S. Exports First Shale Gas as LNG Tanker Sets Sail from Sabine Pass Terminal,” Reuters, February 24, 2016.
  3. EIA, “U.S. Natural Gas Exports and Re-Exports by Country,” accessed June 30, 2026.
  4. Charles Hua, Skyrocketing Utility Bills Nationwide Leave American Consumers Feeling Stressed, Powerless, PowerLines, April 23, 2025.
  5. Timothy Gardner, “Trump Lifts Freeze on LNG Export Permit Applications,” Reuters, January 21, 2025.
  6. Global LNG Capacity Tracker, International Energy Agency, accessed June 17, 2026.
  7. Based on the 6 Bcf/d cited in the S&P Global estimate discussed in the section on Data Center Gas Demand and the 2025 power sector gas consumption in EIA, “Natural Gas Consumption by End Use” accessed June 30, 2026.
  8. Mia Beams and Akkshath Subrahmanian, “Congress’s ‘One Big Beautiful Bill’ Will Shrink Renewable Energy Investments – Yet Some Technologies Are Preserved,” Council on Foreign Relations, August 4, 2025.
  9. Steven Cohen, “Trump’s War on Wind,” Columbia School of Professional Studies, March 30, 2026.
  10. Rystad Energy, “Upstream Solution,” accessed June 30, 2026.
  11. James D. Hamilton, “Causes and Consequences of the Oil Shock of 2007-08,” Brookings Papers on Economic Activity, Spring 2009, pp. 215-283.
  12. EIA, “U.S. Natural Gas Consumption by End Use,” accessed June 30, 2026.
  13. U.S. Bureau Of Labor Statistics, “Consumer Price Index for All Urban Consumers (CPI-U): 12-Month Percent Change: All Items, Less Food and Energy,” accessed on June 29, 2026.
  14. EIA, “Natural Gas Prices,” accessed June 30, 2026.
  15. EIA, “Electricity Data Browser: Average Retail Price of Electricity, United States, Annual” accessed on June 29, 2026.
  16. EIA, “February 2026 Monthly Energy Review, Electricity, Table 7.2a” accessed March 2026.
  17. Curtis Williams, “Ten Years After First Cargo, US LNG Dominance Set to Keep Growing,” Reuters, February 24, 2026.
  18. EIA, “Ten Years After First Sabine Pass Cargo, U.S. LNG Exports are Still On the Rise,” Today in Energy, February 24, 2026, 2026.
  19. EIA, Henry Hub Natural Gas Spot Price, accessed June 29, 2026.
  20. EIA, “U.S. Natural Gas Exports and Re-Exports by Country,” accessed June 30, 2026.
  21. Robin Saha, Robert D. Bullard, Liza T. Powers, Liquefying the Gulf Coast: A Cumulative Impact Assessment of LNG Build Out in Louisiana and Texas, Bullard Center for Environmental and Climate Justice, May 2024; Physicians For Social Responsibility, “Compendium of Scientific, Medical, and Media Findings Demonstrating Risks and Harms of Fracking and Associated Gas and Oil Infrastructure,” October 27, 2023.
  22. Johanna Heureaux-Torres, Andres Chang, Timothy Donaghy, Permit to Kill: Potential Health and Economic Impacts from U.S. LNG Export Terminal Permitted Emissions, Greenpeace and Sierra Club, August 2024.
  23. Deborah Gordon et al., “Evaluating Net Life-Cycle Greenhouse Gas Emissions Intensities from Gas and Coal at Varying Methane Leakage Rates,” Environmental Research Letters 18, no. 8, 2023.
  24. See https://www.certifieddisasters.com.
  25. IEA, “Global Methane Tracker 2026, Key Findings,” 2026.
  26. Christina Swanson, Amanda Levin, and Amy Mall, Sailing to Nowhere: Liquefied Natural Gas is Not an Effective Climate Strategy, Natural Resources Defense Council, December 8, 2020.
  27. EIA, “Natural Gas Deliveries to U.S. LNG Export Facilities Set a Record in First-Half 2023,” EIA Today in Energy, July 31, 2023.
  28. Andres Chang et al., “Failing the ‘Climate Test’: LNG Projects Awaiting Final Investment Decision Do Not Stand Up to U.S. Government Analysis,” Greenpeace, Earthworks, and Oil Change International, July 2025.
  29. Kaushal Ramesh and Mathieu Utting, “Why US LNG Won’t Stop Flowing? The Economics That Won’t Break,” Rystad Energy Thought Leadership, February 8, 2026
  30. EIA, “Natural Gas Prices,” accessed June 30, 2026; EIA, “Average retail Price of Electricity United States Annual,” accessed June 30, 2026.
  31. EIA, “Natural Gas Prices,” accessed June 30, 2026; EIA, “Average retail Price of Electricity United States Annual,” accessed June 30, 2026; U.S. Census Bureau, “Consumer Price Index for All Urban Consumers (CPI-U)” accessed June 30, 2026.
  32. Hua, “Skyrocketing Utility Bills Nationwide Leave American Consumers Feeling Stressed, Powerless.”
  33. See for example, Sung Je Byun, “Oil and Gas Industry Shows Discipline on Capex, but Risks Remain,” Federal Reserve Bank of Dallas, March 31, 2025, and Anthony Caletka and Richard Rose, “The New Energy Industry Playbook: Navigating Volatility and Capital Efficiency as Competitive Advantage,” pwc, June 4, 2026.
  34. Executive Office of the President of the United States, “Winning the Race: America’s AI Action Plan,” July 2025.
  35. Executive Office of the President of the United States, “Ratepayer Protection Pledge Proclamation,” March 4, 2026.
  36. Charles Paullin, “Few Details on Trump’s Plan for Self-Powered Data Centers,” Inside Climate News, March 4, 2026.
  37. Adam Kay, “Here’s What Makes Up Your Natural Gas Bill,” American Gas Association, November 4, 2025.
  38. Kay, “Here’s What Makes Up Your Natural Gas Bill.”
  39. The average wholesale price for U.S. gas (Henry Hub) from 2016 to 2025 was $3.18/MMBtu. In 2023 it was $2.53. EIA, “Natural Gas Spot and Futures Prices,” accessed June 30, 2026.
  40. Kay, “Here’s What Makes Up Your Natural Gas Bill.”
  41. Executive Office of the President of the United States, “American Energy Dominance Is Back Under President Trump,” February 24, 2026.
  42. Executive Office of the President of the United States, “Winning the Race: America’s AI Action Plan.”
  43. International Gas Union, 2025 World LNG Report, November 17, 2025.
  44. EIA, “U.S. Liquefaction Capacity 2Q-2026,” accessed July 1, 2026.
  45. EIA, “U.S. Liquefaction Capacity 2Q-2026.
  46. EIA, “Natural Gas Deliveries to U.S. LNG Export Facilities Set a Record in First-Half 2023,” Today in Energy, July 31, 2023.
  47. EIA, “North America’s LNG Export Capacity is On Track to More Than Double by 2028,” EIA In-Brief Analysis, September 3, 2024.
  48. EIA, “Annual Energy Outlook 2025,” April 15, 2025.
  49. EIA, “AEO 2025 Data Viewer Table: Table 2. Energy Consumption by Sector and Source, Reference Case, Total Energy Consumption, Natural Gas and Electric Power, Natural Gas,” accessed June 29, 2026.
  50. U.S. Department of Energy, “DOE Statement on EIA Annual Energy Outlook,” April 15, 2025.
  51. Maya Gibbs, “Trump’s War on Solar & Wind: A Timeline of Recent Federal Actions,” Third Way, October 16, 2025.
  52. Collin Rees, “Paying for Climate Chaos: U.S. Federal Subsidies to Fossil Fuel Production,” Oil Change International, September, 2025.
  53. EIA, “Annual Energy Outlook 2026,” accessed June 29, 2026, (Note: This URL is for the current year AEO. When the AEO 2027 is released in April 2027, the AEO 2026 will be archived at a different URL.)
  54. EIA, “AEO 2025 Data Viewer Table: Table 2. Energy Consumption by Sector and Source, Reference Case, Total Energy Consumption, Natural Gas and Electric Power, Natural Gas,” accessed June 29, 2026; “AEO 2026 Data Viewer Table: Table 2. Energy Consumption by Sector and Source, Reference Case, Total Energy Consumption, Natural Gas and Electric Power, Natural Gas,” accessed June 29, 2026.
  55. EIA, “AEO 2025 and 2026 Data Viewers, Table 2 Energy Consumption by Sector and Source, Energy Use, Electric Power Sector,” accessed June 30, 2026.
  56. Kristy Kramer and Dulles Wang, “Defying Gravity: Why US Henry Hub Natural Gas Prices Are Set To Rise,” Wood Mackenzie Horizons, July 2026.
  57. Jenny Martos, “Betting Big on Data Centers, U.S. Now Leads World for New Gas Power Development,” January, 2026, Global Energy Monitor.
  58. Martos, “Betting Big on Data Centers, U.S. Now Leads World for New Gas Power Development.”
  59. Global Energy Monitor, “Global Oil and Gas Plant Tracker,” January 2026 release.
  60. Martos, “Betting Big on Data Centers, U.S. Now Leads World for New Gas Power Development.”
  61. EIA, Annual Energy Outlook 2025, accessed June 30, 2026.
  62. Michael V. Grande, “Data Centers: More Gas Will Be Needed To Feed U.S. Growth,” S&P Global, October 22, 2024.
  63. Based on EIA, “U.S. Natural Gas Consumption by End Use,” accessed June 30, 2026.
  64. BNEF, “US Data Center Gas Demand Outlook: 2025-2035,” November 18, 2025, Subscription Only.
  65. BNEF, “US Data Center Gas Demand Outlook: 2025-2035.”
  66. BNEF, “US Data Center Gas Demand Outlook: 2025-2035.”
  67. Kramer and Wang, “Defying Gravity: Why US Henry Hub Natural Gas Prices Are Set To Rise.”
  68. Attracta Mooney and Rachel Millard, “Wartime Jolt Pushes Buttons on Renewable Power,” The Financial Times, June 17, 2026.
  69. BNEF, “US Gas Market Outlook 2030: LNG Export Surge Lifts Demand. Rapidly Growing US Gas Exports Pose a Significant Challenge for Supply,” September 16, 2025, Subscription Only.
  70. Kramer and Wang, “Defying Gravity: Why US Henry Hub Natural Gas Prices Are Set To Rise.”
  71. Kramer and Wang, “Defying Gravity: Why US Henry Hub Natural Gas Prices Are Set To Rise.”
  72. BNEF, “US Gas Market Outlook 2030.”
  73. BNEF, “US Gas Market Outlook 2030.”
  74. BNEF estimated $3.73/MMbtu as the marginal supply cost in the late 2020s, which we converted to mcf for consistency with the rest of the analysis in this section. 1 mcf = 1.037 MMBtu.
  75. CME Group, “Henry Hub Natural Gas,” accessed June 30, 2026.
  76. CME Group, “Henry Hub Natural Gas.
  77. CME Group, “Henry Hub Natural Gas Futures – Settlements,” accessed June 29, 2026.
  78. CME Group, “Henry Hub Natural Gas Futures – Settlements.”
  79. BNEF, “U.S. Gas Market Outlook 2030.”
  80. BNEF, “U.S. Gas Market Outlook 2030.”
  81. EIA, “We Expect Henry Hub Natural Gas Spot Prices to Fall Slightly in 2026, Before Rising in 2027,” In-Brief Analysis, January 14, 2026.
  82. EIA, “We Expect Henry Hub Natural Gas Spot Prices to Fall Slightly in 2026, Before Rising in 2027.
  83. EIA, “EIA Forecasts Lower Oil Prices in 2026 and 2027 Due to Persistent Stock Builds,” EIA In-Brief Analysis, February 11, 2026.
  84. IEA, Oil Market Report, January 21, 2026, pp.25-26.
  85. Robert Stewart, “Mitsubishi to Buy Haynesville Shale Assets for $7.5 Billion,” Upstream Online, January 16, 2026.
  86. JERA, “JERA to Acquire Interest in Haynesville Shale Gas Asset in Louisiana,” October 23, 2025.
  87. Osaka Gas USA, “Osaka Gas USA Projects,” accessed June 30, 2026.
  88. Tokyo Gas, “Joint Development Agreement for Shale Gas Business with Chevron in the United States to Expand Revenue Through Energy Value Chain Development,” April 1, 2025.
  89. Amber McCullagh, “Appalachia and Haynesville Outlook: How are Key Gas Plays Going to Respond to Higher Henry Hub Prices?,” presentation for RBN Energy’s GasCon 2026, February 25, 2026, Subscription Only. See https://www.measureddepth.com/.
  90. Amber McCullagh, “Appalachia and Haynesville Outlook: How are Key Gas Plays Going to Respond to Higher Henry Hub Prices?,” presentation for RBN Energy’s GasCon 2026, February 25, 2026, Subscription Only. See https://www.measureddepth.com/.
  91. EIA, “Haynesville Internal Rate of Return by Natural Gas Price Scenario,” EIA Natural Gas Weekly Update, June 8, 2023.
  92. Enverus, “Proppant: the Greatest Oilfield Innovation,” accessed June 30, 2026.
  93. Rystad Energy Shale Analytics, “Eye-Popping West Haynesville Wells Still Need Over $4 Gas to Break Even,” November 21, 2025, Subscription Only.
  94. Hua, “Skyrocketing Utility Bills Nationwide Leave American Consumers Feeling Stressed, Powerless.”
  95. Sung Je Byun, “Oil and Gas Industry Shows Discipline on Capex, but Risks Remain,” Federal Reserve Bank of Dallas, March 31, 2025.
  96. David Wethe and Kevin Crowley, “Shale’s Bust Shows Basis of Boom: Debt, Debt and Debt,” Bloomberg, July 22, 2020, accessed on June 30, 2026.
  97. Alexandre Ramos-Peon, “2024: A Defining Year for the Shale Industry,” Rystad Energy, October 24, 2023.
  98. Rebecca F. Elliott, “U.S. Oil Is Skipping the Chance to Grab Market Share From the Gulf,” The New York Times, June 22, 2026.
  99. United Nations Office of the High Commissioner on Human Rights, “UN Experts Denounce Aggression on Iran and Lebanon, Warn of Devastating Regional Escalation,” March 12, 2026.
  100. Mike Soraghan, “Why Natural Gas Bills Aren’t Rising Like Prices at the Pump,” E&E News, March 30, 2026.
  101. Curtis Williams, “US LNG Exports Fall in May on Maintenance, Asia’s Take Rises,” Reuters, June 2, 2026.
  102. Average of weekly Henry Hub Prices from EIA, “Henry Hub Natural Gas Spot Price,” accessed June 30, 2026.
  103. EIA, “AEO 2026, Table 1. Total Energy Supply, Disposition, and Price Summary, Nominal Price, Gas Price at Henry Hub,” accessed June 30, 2026.
  104. EIA, “Natural Gas Prices,” accessed June 30, 2026; EIA, “Electricity Data Browser: Average Retail Price of Electricity, United States, Annual,” accessed on June 29, 2026.
  105. EIA, “U.S. Natural Gas Exports and Re-Exports by Country,” accessed June 30, 2026.
  106. EIA, “U.S. Natural Gas Exports and Re-Exports by Country,” accessed June 30, 2026.
  107. Global LNG Hub, “Woodside’s Louisiana LNG Selldown: Smart Cash Move, Complex Structure,” October 23, 2025.
  108. Ramesh and Utting, “Why US LNG Won’t Stop Flowing: The Economics That Won’t Break.”
  109. Adila McHich, “U.S. LNG Exports Usher New Era in Gas Trading,” CME Group, January 6, 2025.
  110. Curtis Williams and Chen Aizhu, “US LNG Exporters Seek to Renegotiate Deals to Cover Rising Costs,” Reuters, March 10, 2025.
  111. Curtis Williams, “US LNG Producers Ink Near Record Contract Volumes, Even as Fees Climb,” Reuters, November 6, 2025.
  112. Curtis Williams, “Venture Global Cashes In on Exports from Plaquemines LNG Plant, SEC Filing Shows,” Reuters, July 7, 2025.
  113. Kassia Micek & Nushin Huq, “CERAWEEK: Renewables Ready to Go, Labor and Parts Delays Gas Plants: NextEra CEO,” S&P Global, March 10, 2025.
  114. Jacob Dick, “Golden Pass LNG Reports Sustained Feed Gas Flows – Three Things to Know About the LNG Market,” Natural Gas Intelligence, July 25, 2025.
  115. Robert Stewart, “US Tariff War Already Increasing Costs for US LNG Industry,” Upstream Online, April 17, 2025.
  116. IEA, “Gas Market Report – Q2 2026,” April 24, 2026, p. 47.
  117. Mitchell Beer, “Global Gas Glut Could Undercut Demand for Ksi Lisims LNG,” The Energy Mix, June 11, 2026.
  118. Malcolm Moore and Jamie Smyth, “US Rush to Expand LNG Exports Heightens Fears of Global Gas Glut,” The Financial Times, October 3, 2025.
  119. EIA, “U.S. LNG Developers Sign Highest Volume of Sale and Purchase Contracts Since 2022,” EIA In-Brief Analysis, March 3, 2026.
  120. Global Energy Monitor, “Global Gas Infrastructure Tracker,” accessed July 3, 2026.
  121. Ramesh and Utting, “Why US LNG Won’t Stop Flowing: The Economics That Won’t Break.”
  122. Kramer and Wang, “Defying Gravity: Why US Henry Hub Natural Gas Prices Are Set To Rise.”

Cite this work

“Pay, Baby, Pay: Why Trump’s Energy & AI Dominance Agenda Means Higher Bills For Everyone.” Oil Change International, July 28, 2026, https://oilchange.org/publications/pay-baby-pay/.